
Have you ever faced the frustration of sifting through unclear survey results and wished there was a way to make sense of it all?
Well, that’s where survey reports come in!
If you’re analyzing customer feedback, measuring employee satisfaction, or diving into market research, crafting a strong survey report is key to making the data speak clearly.
In this blog post, I’ll walk you through the best practices for writing survey reports—how to structure your findings and present it in a way that grabs attention.
What is a Survey Report?
A Survey Report is a summary of the survey where all the findings and analysis carried out to help you extract important data patterns and insights. These reports are used mainly by businesses, stakeholders, and other people to take action based on the data collected.
With a well-crafted survey report, the results are not just numbers — they become a story that drives action and understanding.
Having understood what a survey report is, let’s discuss why you need one.
Why is a Survey Report Important?
Suppose you are conducting a survey and are getting hundreds or even thousands of replies. In the absence of a well-structured report, all those replies are just scattered data points. A survey report helps you:
- Identify trends and patterns within survey data
- Offer the stakeholders ONLY meaningful insights
- Enables data-driven decision making
- Understand customer expectations and experience
Basically, building a comprehensive survey report is important for analyzing the outcomes and taking necessary steps further.
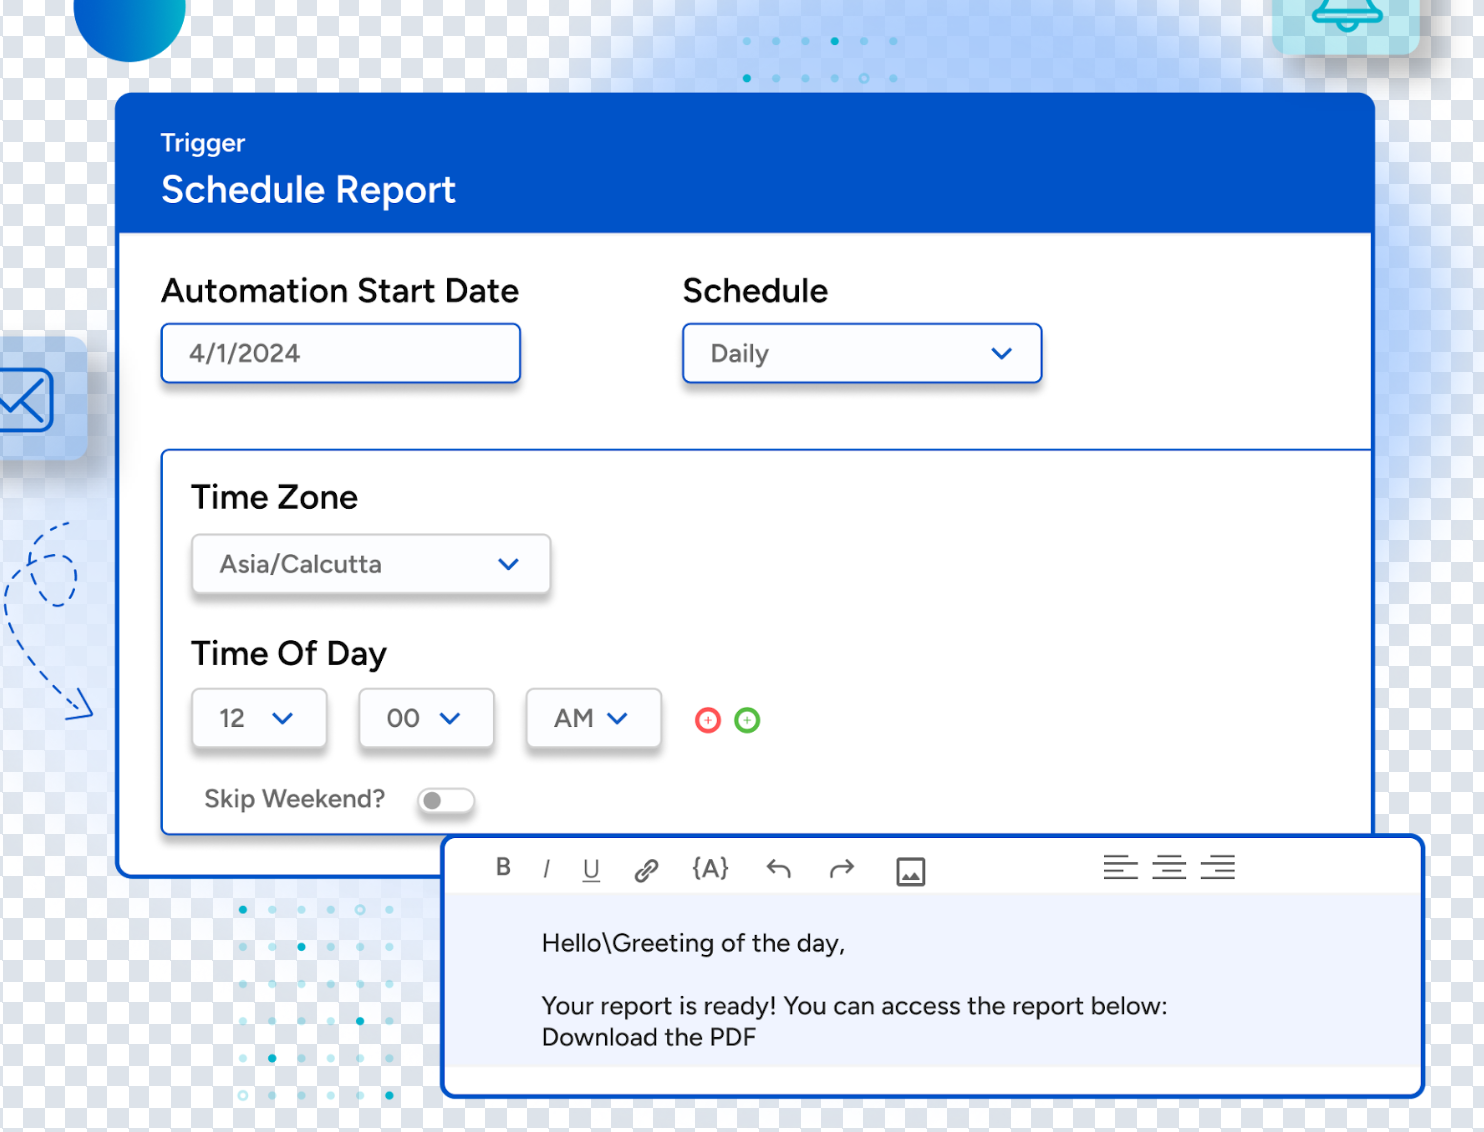
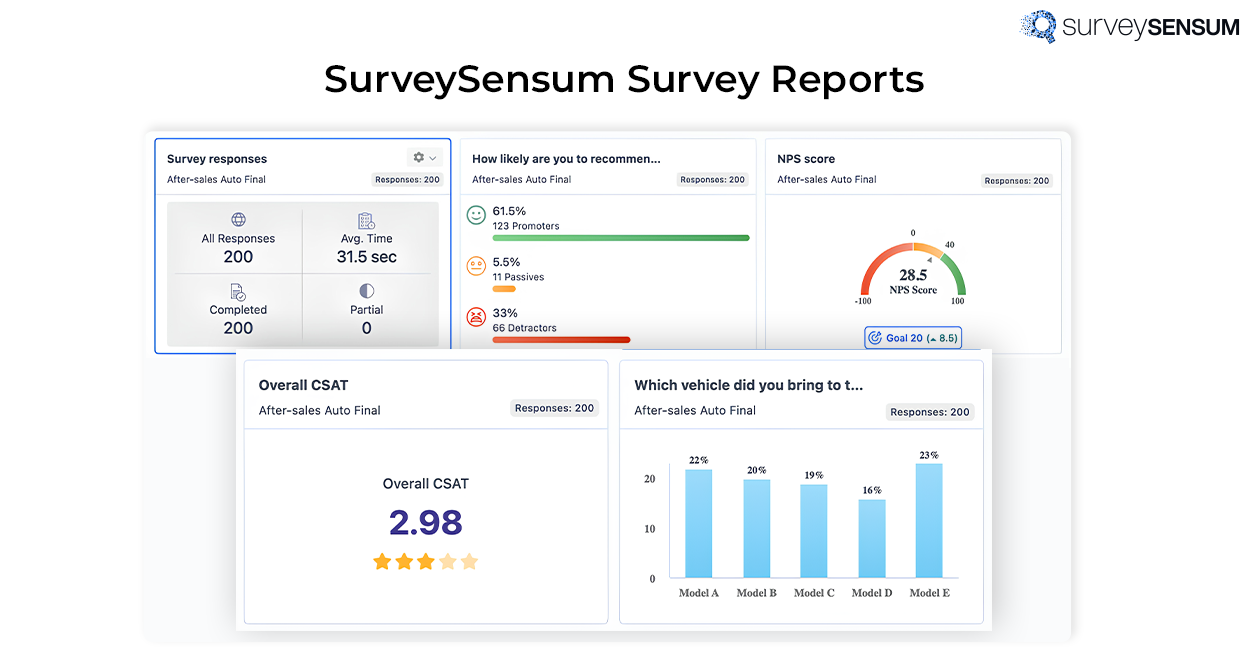
With SurveySensum, you don’t have to CREATE the survey report – you’ll get one directly to your mailbox with a click of a button. Not just that, you can schedule it weekly, fortnightly, monthly, and so on..
From NPS to CSAT to CES, see exactly where you’re winning and where to improve with SurveySensum’s powerful reporting engine!
Free Forever • No Feature Limitation • No Credit Card Required • Sign Up For Free ![]()
Now that you know what an analytical report can do, let’s go through the structure of writing an efficient report.
Breaking Down the Structure of Writing a Survey Report
Suppose you conducted a survey to gauge customer satisfaction with an online clothing store. The goal of the survey is to identify areas for improvement in product quality, delivery speed, and customer service.
Now, we’ll break down the steps to create a report for this survey.
1. Introduce with Survey Summary and Key Insights
Start with a concise title that captures the essence of your survey, such as “Customer Satisfaction Survey: Key Insights and Areas for Improvement.”
The introduction should briefly outline the background, explaining the problem the survey addresses and why it was conducted. This helps prepare the reader for the findings to come and underscores the significance of the study.
For example: “We conducted a customer satisfaction survey for an online clothing store to identify areas where product quality, delivery speed, and customer service can be improved. This survey is essential for understanding what customers value most, where improvements are needed, and how we can enhance the overall customer experience.”
You can also add text analysis and sentiment analysis of open-ended questions (if any) in surveys. They offer additional context to the numerical data, revealing underlying emotional trends that enhance the overall understanding of respondents’ views.
2. State Objectives and Purpose of the Survey Report
What specific issues were addressed? Outlining these objectives helps the reader grasp the focus of the survey and its relevance.
For example: The primary objective of this survey was to measure customer satisfaction with three main aspects:
- Product Quality: Are customers satisfied with the quality of the clothing?
- Delivery Speed: How efficient is the delivery process in terms of timeliness?
This section sets the scope of the research and ensures that readers understand what areas were covered and why they matter.
3. Methodology: How is the Survey Conducted?
Now, writing a survey report means you have to delve into the specifics of how the survey was conducted:
- Survey Procedure: Explain which survey method was used (for instance, online surveys or interviews) and why this method was the best choice for this type of research. Online surveys are chosen for this survey because they are cost-effective, easily accessible, and allow for quick collection of responses.
- Sample Size: Describe how many participants were involved and how they were selected. Make sure the sample is representative of the larger population to guarantee reliable results.
For example: “The survey received responses from 500 customers who had purchased from our store in the past six months. The sample was randomly selected to ensure a diverse and representative cross-section of our customer base.”
- Data Collection Process: Specify when and how the survey was distributed, what tools were used, and any platforms (social media, email newsletters, website pop-ups) that helped reach participants.
For example: “The survey was distributed via email over a period of two weeks. An incentive of a 10% discount on the next purchase was offered to encourage participation. The responses were collected through an automated online survey tool, ensuring efficient data capture and real-time reporting.”
This section not only describes the process but also supports the credibility of the data by demonstrating how it was collected.
4. Result: Findings and Analysis
Now, present your survey results clearly:
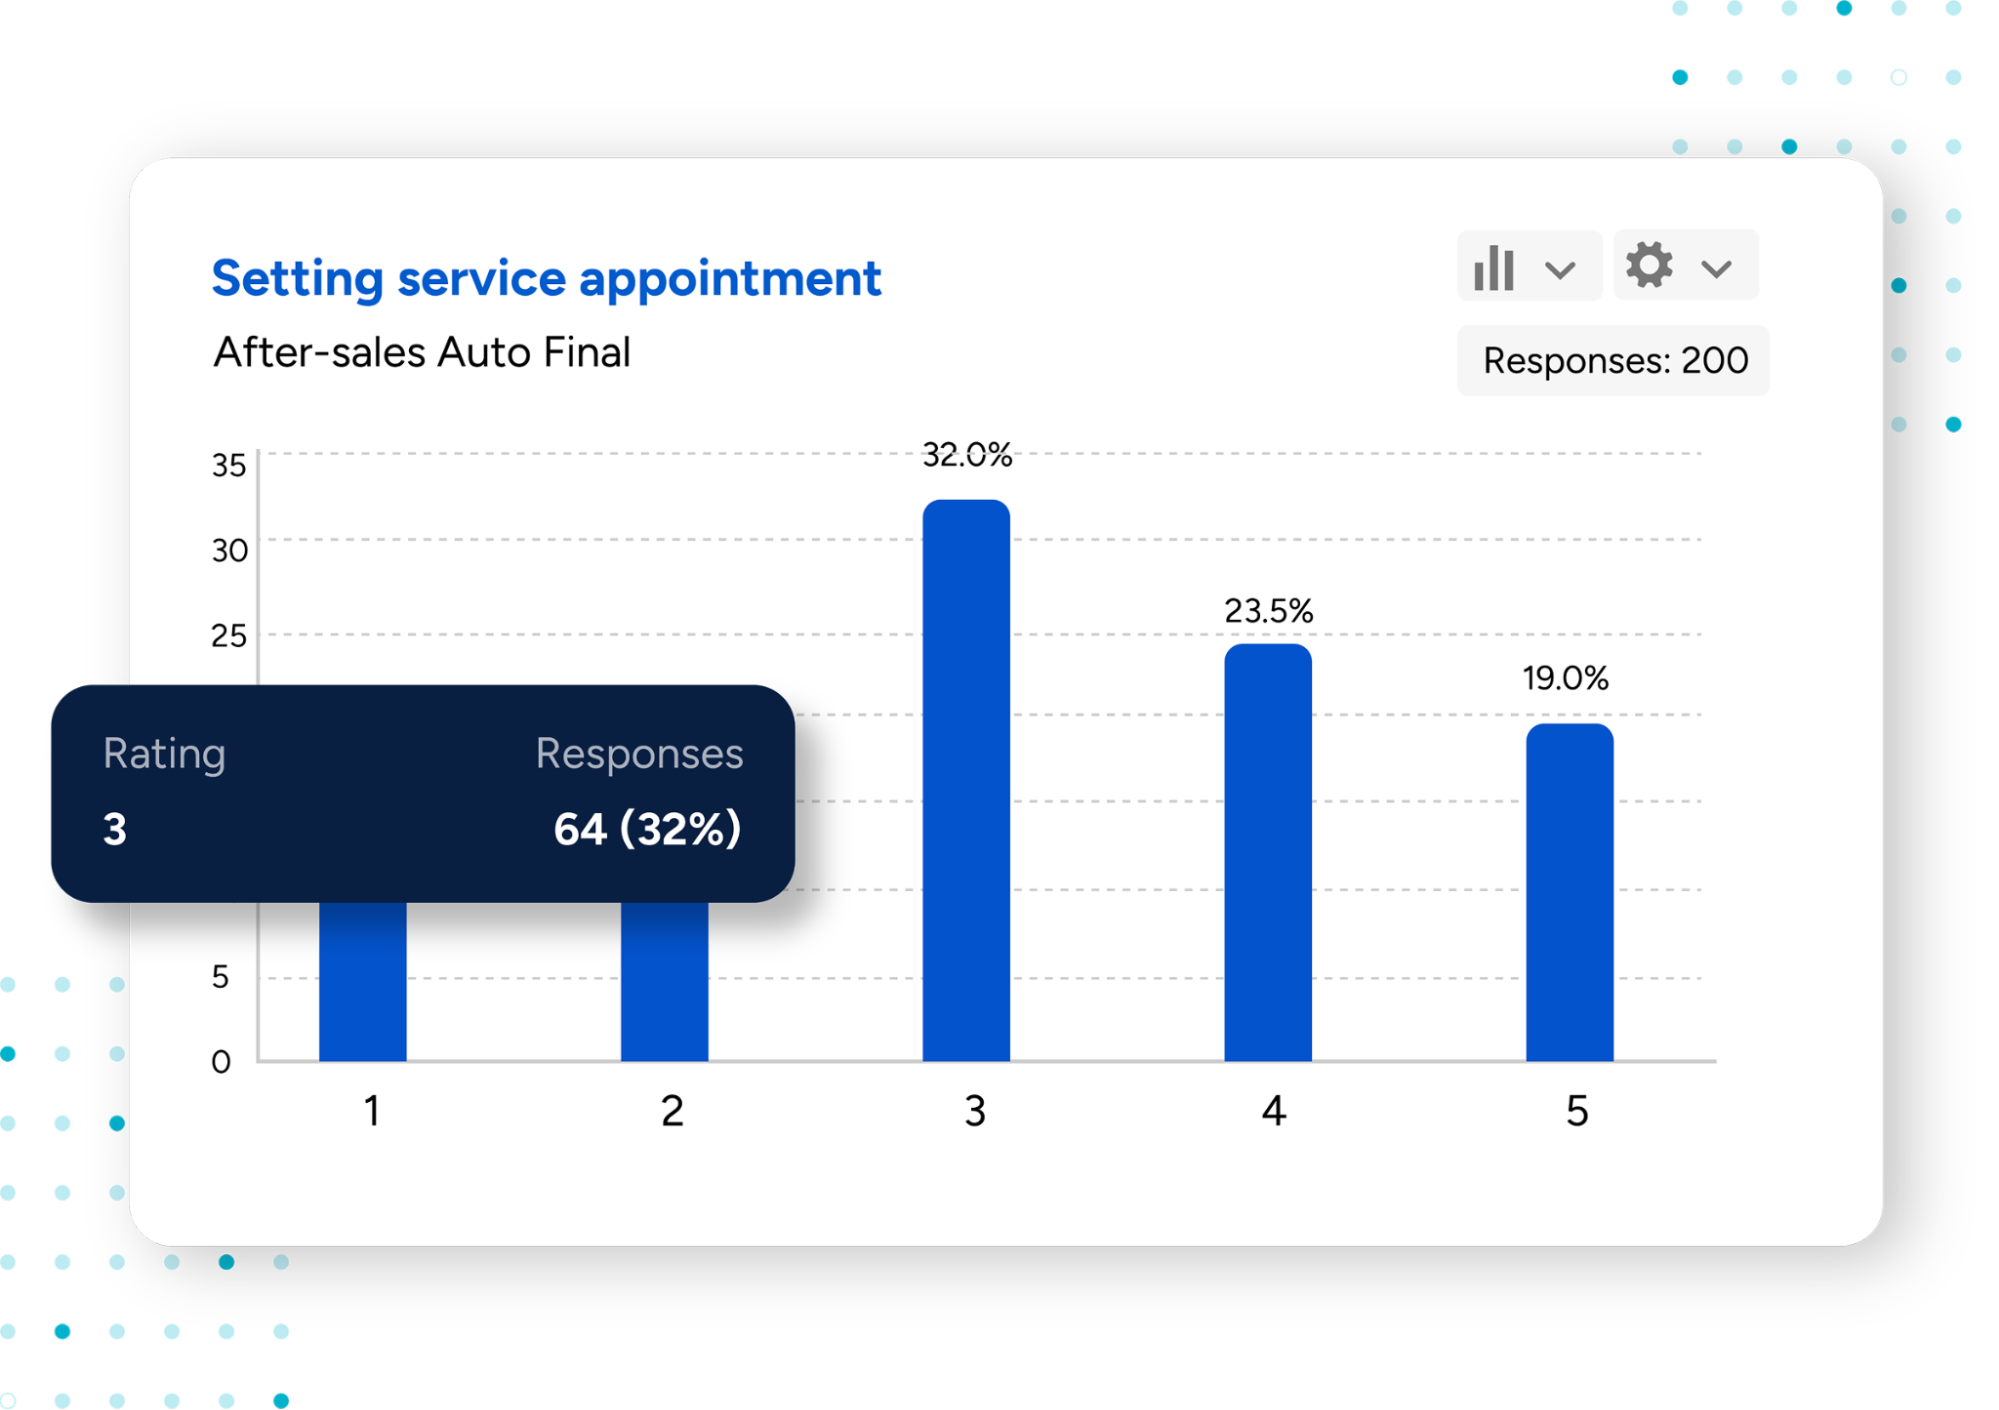
- Data Presentation: Organize your data with visual aids such as tables, graphs, or pie charts. Visuals help readers understand the findings quickly and intuitively. Platforms like SurveySensum can create visually appealing charts and summaries to make key findings easy to interpret.
For example:
- A bar graph comparing satisfaction with product quality, delivery speed, and customer service.
- A pie chart showing the percentage of respondents satisfied with their delivery time.
- Analysis: Survey data analysis is where you interpret the results and explain what they mean. Instead of simply listing numbers, show how they translate into actionable insights. Such a survey report format allows for better insights.
For example: “While 85% of customers expressed satisfaction with the product quality, 15% indicated concerns about fabric durability. This suggests that although the overall product quality is good, certain items may require better material choices.”
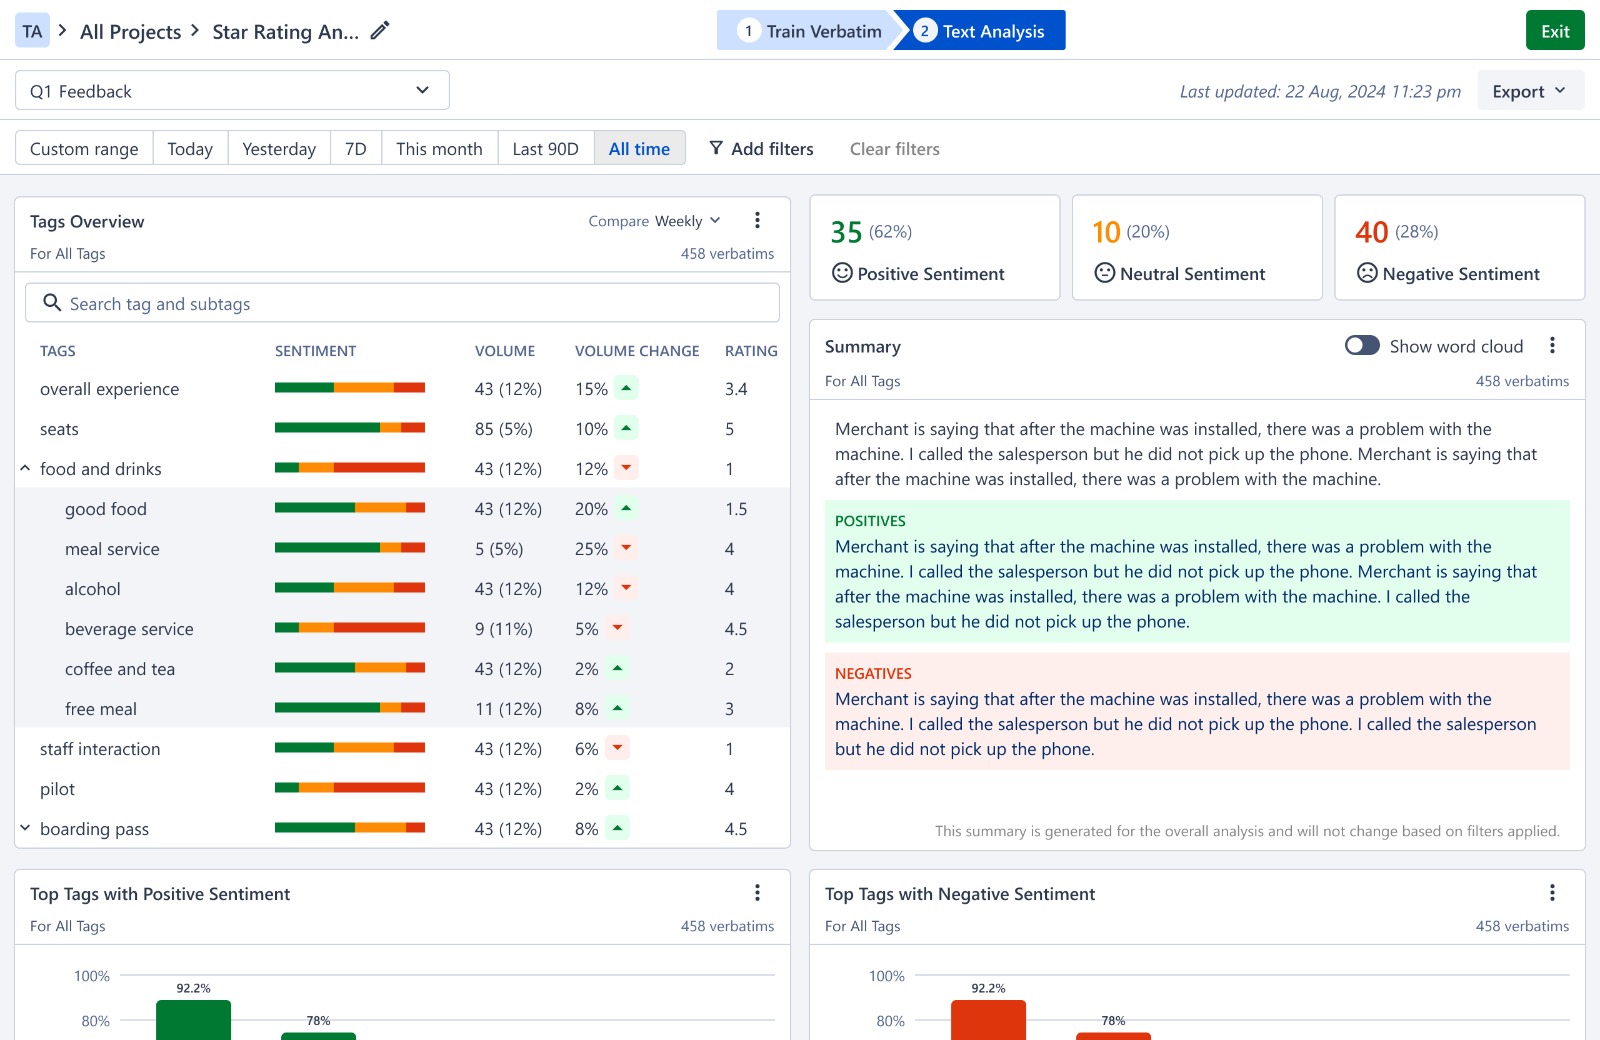
SurveySensum’s AI-powered text analytics software to automatically categorize feedback by tagging and sub-tagging it based on keywords and themes. To enhance precision and tailor categorization to specific business requirements, users can further train these AI models. This AI can analyze up to 10,000 open-ended responses with 99% accuracy in just 5 seconds. This capability allows businesses to rapidly pinpoint crucial trends and sentiments, eliminating the need for manual processing.
5. What’s the Takeaway?
- Conclusion: Towards the end of writing a survey report, conclude with a summary of the findings and their implications.
For example: “The survey findings highlight that while customers are mostly satisfied with the product and customer service, there is a clear need for improvement in delivery times. The data suggests that speeding up deliveries will significantly improve customer satisfaction.”
- Recommendations: Based on your conclusions, offer actionable steps for improvement. This section gives readers clear directions on how to address the issues identified.
For example:
- Product Quality: Focus on improving the durability of fabrics in top-selling items.
- Delivery Speed: Partner with faster delivery services and offer express shipping options.
This section bridges the gap between data and practical application, guiding future actions.
6. Appendices and References (if applicable)
Finally, include any supplementary materials that may be useful to the survey report:
- Appendices: Offer detailed data tables, the full survey questionnaire, or additional charts that provide deeper insight into the survey results.
For example:
“Appendix A: Full Survey Questionnaire”
“Appendix B: Detailed Data Tables of Product Quality Satisfaction“
- References: Cite any research or external sources that informed your survey design or analysis. This adds credibility and allows readers to explore related studies or methodologies.
For example: “Smith, J. (2023). Understanding Customer Satisfaction in Online Retail. Retail Insights Journal.”
By following such an approach, your survey report will effectively communicate your research process and findings, making it a priceless resource for better decision-making.
Create automated survey reports with a click of a button
Free Forever • No Feature Limitation • No Credit Card Required • Sign Up For Free ![]()
Survey Metrics You Must Track for Reliable Data
When analyzing your survey results, tracking the right metrics is crucial for extracting crucial insights. We’ve gathered some key survey metrics that will help you evaluate the effectiveness of the survey and ensure high-quality data collection:
1. Completion Rate
The completion rate reflects the rate of respondents who completed the survey against those who started it. A higher survey completion rate means that the survey was meaningful for the respondents, whereas a low rate signals issues such as excessive length or complex questions. Monitoring this helps pinpoint potential barriers to completion, allowing for refinements that improve response rates and data reliability.

2. Number of Responses
This metric measures how many people participated in your survey, indicating both its reach and engagement levels. A higher response rate strengthens the statistical credibility of your findings, making them more representative and reliable. However, ensuring that responses come from your target demographic is equally important for maintaining data accuracy and relevance.
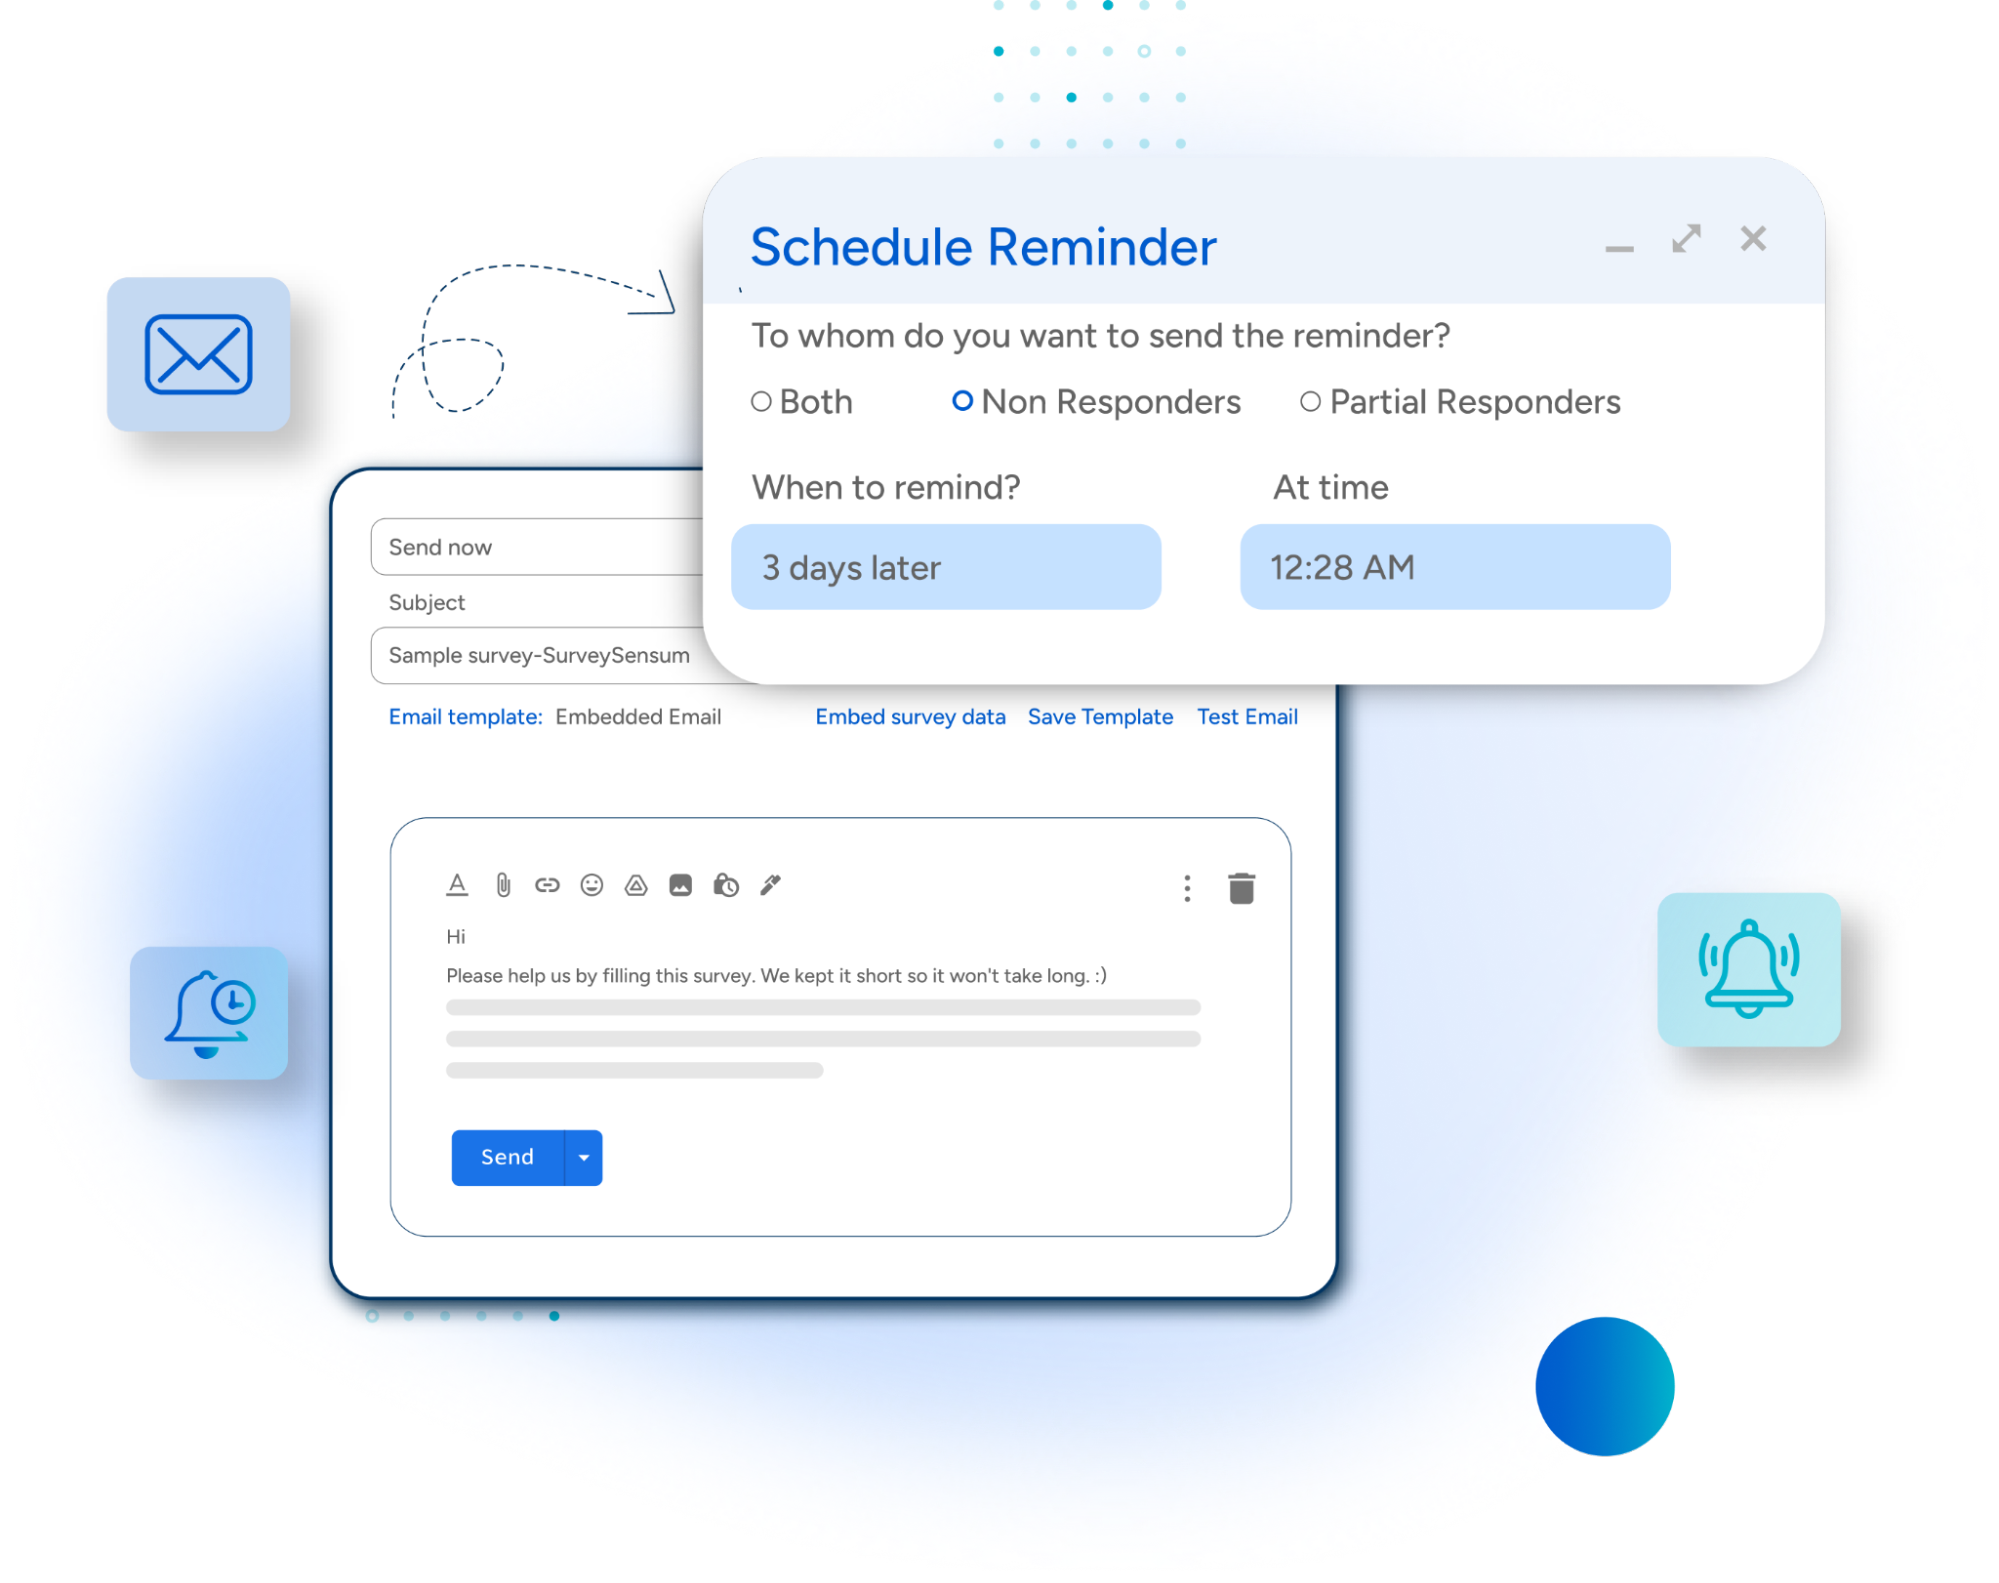
SurveySensum’s smart survey reminder feature automatically nudges non-respondents with gentle follow-ups, boosting participation without spamming their inbox. The result? Higher response rates, better data quality, and more informed decisions, effortlessly.
3. Date of Last Response
Understanding when the last response was recorded helps track survey activity over time. This metric provides insight into the effectiveness of your distribution strategy and identifies peak engagement periods. It also helps set a clear cutoff point for analysis, ensuring all responses are considered within a defined timeframe.
4. Survey Views
This metric shows how many people accessed or opened the survey link. Comparing survey views to actual responses can reveal participation rates and highlight potential drop-off points. If many people view the survey but don’t complete it, there may be issues with the introduction, length, or question clarity. Optimizing these elements can help convert more views into completed responses.
5. Breakdown of Answers per Survey Respondent
Analyzing how respondents interact with the survey provides deeper insight into engagement levels. This includes identifying patterns, such as frequently skipped or misunderstood questions, which can guide improvements in survey design. Additionally, detecting inconsistent or contradictory responses helps enhance data accuracy and reliability.
6. Breakdown of Closed-Ended Questions
Closed-ended questions, which offer predefined answer choices, make analysis easier by enabling quantitative evaluation. Reviewing this data helps identify trends, preferences, and commonalities among respondents. These insights are essential for making informed, data-driven decisions and refining strategies based on respondent feedback.
These service metrics make sure that you stay in the right lane while making your report. Having said that, it’s time to jump into the most important part.
Let’s see how we can write our survey report in the most effective way in the following section.
Step-by-Step Guide to Writing a Survey Report
To prepare an effective report, there should be a systematic process for it to become clear, accurate, and actionable. Below is a step-by-step guide to preparing a well-organized survey report that effectively communicates data.
Step 1: Decide On Your Goals
- Define the Purpose: You need to begin by specifying the reason for conducting the survey. Having a purpose in mind directs your research aim as well as avoids the survey from responding to anything randomly or indiscriminately.
- Define the Target Audience: Who will you be surveying? It is vital to identify your target audience to get the right data and ensure that the data you collect is helpful for your needs.
Step 2: Gather and Organize Data
- Data Collection Methods: Choose appropriate methods of data collection, i.e., online surveys, interviews, or focus groups. Appropriate choice of the method ensures the reliability and quality of data collected.
- Sort Survey Responses: Group similar answers into a single category. Sorting data helps to make the analysis and pattern or trend identification of the answers simpler. You can take from our survey builder to do so efficiently.
Step 3: Interpret Survey Findings
- Statistical Analysis Techniques: Using the right statistical methods ensures meaningful survey data analysis. Cross-tabulation, for example, helps analyze relationships between variables, like comparing customer satisfaction across age groups to identify trends and preferences.
- Identifying Key Trends and Insights: Look for recurring patterns or significant conclusions from the data. With AI-powered analysis, the system automatically identifies top trending themes, patterns, and key insights, helping to interpret the broader implications of the survey findings.
Step 4: Write the Report
- Be Clear and Concise: Structure your report in a logical manner, starting with an introduction, methodology, findings, and conclusions. Clear presentation makes it easy for readers to understand and follow the information. You can also use an AI presentation maker to turn your survey results into simple, professional visuals.
- Use Visuals: Use visual aids to display data efficiently. Visuals make understanding easier by illustrating complex information in a simple way. When it comes to visualizing your pitch deck, it’s worth to hire a presentation design agency that can take care of your presentation and its visuals and make it look better for your audience.
Step 5: Draw Conclusions and Make Recommendations
- Summarizing Key Findings: Provide a concise overview of the most important findings. Summarizing key findings highlights the most important issues of the survey that need to be addressed. To support recommendations with real examples, teams often turn survey findings into documented outcomes using a case study generator.
- Giving Actionable Insights: Make recommendations based on the survey outcomes. Actionable insights guide stakeholders in making smart decisions or instigating the required changes.
Step 6: Edit and Review the Report
- Verifying for Consistency and Clarity: Double-check to ensure that the report is clear and not conflicting. Reviewing for consistency and clarity makes the report professional and readable.
- Maintaining Data Accuracy: Make sure that all data presented is accurate and well-sourced. Maintaining data accuracy makes the report credible and the findings trustworthy.
By going through these steps in a logical sequence, you can produce a survey report that clearly tells your story and offers useful data for decision-making.
Your survey data has a story to tell, let’s help you decode it! Build smarter Survey Reports with SurveySensum.
Free Forever • No Feature Limitation • No Credit Card Required • Sign Up For Free ![]()
Some Common Mistakes To Avoid While Writing a Survey Report
As you prepare a survey report, it is wise to take caution against pitfalls that can compromise the quality and effectiveness of your findings. These are the mistakes to shun:
- Undefined Purpose: A survey that lacks a precise objective will inevitably be a pointless survey resulting in irrelevant data collection. Having goals ensures that the survey answers important questions and produces actionable information.
- Complex Visuals: Too intricate graphs or charts can confuse the reader. Use simple visuals that convey information effectively.
- Inconsistent formatting: Use of different font sizes, styles, or colors may be confusing and decrease professionalism in the report. There must be consistency in format throughout the paper.
- Missing Important Findings: Failure to capture major patterns or anomalies means missing the possibility for innovation or enhancement. Review data thoroughly to look for and pin such observations.
- Complicating the Analysis: Technical jargon without explanation may confuse readers who are not experts in the subject matter. Report findings in a clear, understandable manner.
- Overanalysis of Irrelevant Information: Being too involved in minor details may hide the key findings and bog down the readers. Concentrate on the most crucial data that supports your cause.
By avoiding these common pitfalls, you can maximize the clarity, relevance, and effectiveness of your survey reports, which will be valuable tools for sound decision-making.
Conclusion
A well-structured survey report transforms raw data into meaningful insights, enabling businesses and researchers to make informed decisions. By following report writing best practices, applying the right statistical analysis techniques, you can ensure clarity and impact in your findings.
Tracking key metrics like completion rate, response numbers, and survey views helps refine survey strategies for better engagement and data accuracy.With the right approach, your business survey reports can drive real change.
Need help streamlining your survey report writing? SurveySensum offers expert solutions to simplify data interpretation and enhance your reporting process. Get started today!
Free Forever • No Feature Limitation • No Credit Card Required • Sign Up For Free ![]()
Frequently Asked Questions on Survey Report
1. What is in a survey report?
A survey report is a document that takes all the responses from a survey and turns them into clear, useful insights. It includes key findings, trends, and data that help understand what respondents think.
2. How do you format a survey report?
A good survey report has a clear structure. It usually starts with an introduction, followed by the survey goals, key findings, data analysis (with charts or graphs), and a conclusion with recommendations. Keep it organized and easy to read!
3. What are the key components of a survey report?
A survey report should include:
- Survey objectives – What was the purpose of the survey?
- Methodology – How was the survey conducted?
- Key findings – The most important results and trends.
- Data analysis – Charts, graphs, or stats to explain the findings.
- Conclusion & recommendations – What the results mean and what to do next.
4. Why are survey reports important?
A survey report helps turn raw responses into insights that businesses and organizations can use. It guides decision-making, improves customer or employee experience, and helps track trends over time.
5. What types of surveys require reports?
Almost any survey can benefit from a survey report! Some common ones include:
- Customer feedback surveys – To understand customer satisfaction.
- Employee surveys – To gauge workplace culture.
- Market research surveys – To analyze industry trends.
- Product feedback surveys – To improve products based on user input.
- Academic or research surveys – For data-driven studies and reports.
Unlock the Power of Your Survey Data! Transform responses into valuable insights with Survey Reports. Start your journey with SurveySensum.
Free Forever • No Feature Limitation • No Credit Card Required • Sign Up For Free ![]()

Increase ROI by 3x with targeted feedback & analysis
Boost Customer Satisfaction by up to 20%
Reduce Churn by identifying pain points in real time
See it in Action
Contents
How much did you enjoy this article?