The Complete Playbook for Qualitative Data Analysis in 2025
A step-by-step guide to conducting effective qualitative data analysis — from collecting customer feedback to extracting meaningful, business-driving insights.
Request a Demo
Do you struggle to analyze open-ended customer feedback?
Does it get even harder when there’s plenty of data to go through, and in different forms like surveys, reviews, interviews, etc?
This is where qualitative data analysis (QDA) can help.
It’s a strategic way of examining open-ended feedback that is often riddled with ambiguity, mixed sentiments, and difficult-to-understand language.
By integrating QDA methods into your feedback analysis, you can easily identify the underlying meaning/ context of the feedback and gain deeper insights from it.
In this guide, we’re breaking down everything you need to know about qualitative data analysis — key methods, benefits, challenges, and how to perform it.
What Is Qualitative Data Analysis?
Qualitative data analysis is the process of closely examining unstructured data, such as open-ended survey responses, customer reviews, or support tickets. The goal is to understand what your customers are feeling, why, and what action you can take to help them.
Before we move to QDA methods, let’s take a quick look at the key differences between qualitative and quantitative data analysis.
How Is Qualitative Data Analysis Different from Quantitative Analysis?
| Aspect | Qualitative Data Analysis | Quantitative Data Analysis |
| Type of Data | Textual or unstructured (e.g., open-ended responses) | Numerical or structured (e.g., ratings, scores) |
| Purpose | To explore personal experiences, opinions, and emotions | To measure trends, satisfaction levels, or performance |
| Data Collection Examples | “What did you like about the service?” | “Rate your satisfaction from 1 to 10” |
| Analysis Approach | Thematic, narrative, or linguistic | Statistical or mathematical |
| Output | Insights into themes, customer stories, and emotional drivers | Averages, percentages, KPIs |
| When to Use | When you want to explore feedback in depth | When you want quick metrics or large-scale trends |
As you can see from the table above, the key difference lies in what you analyze and how you do it.
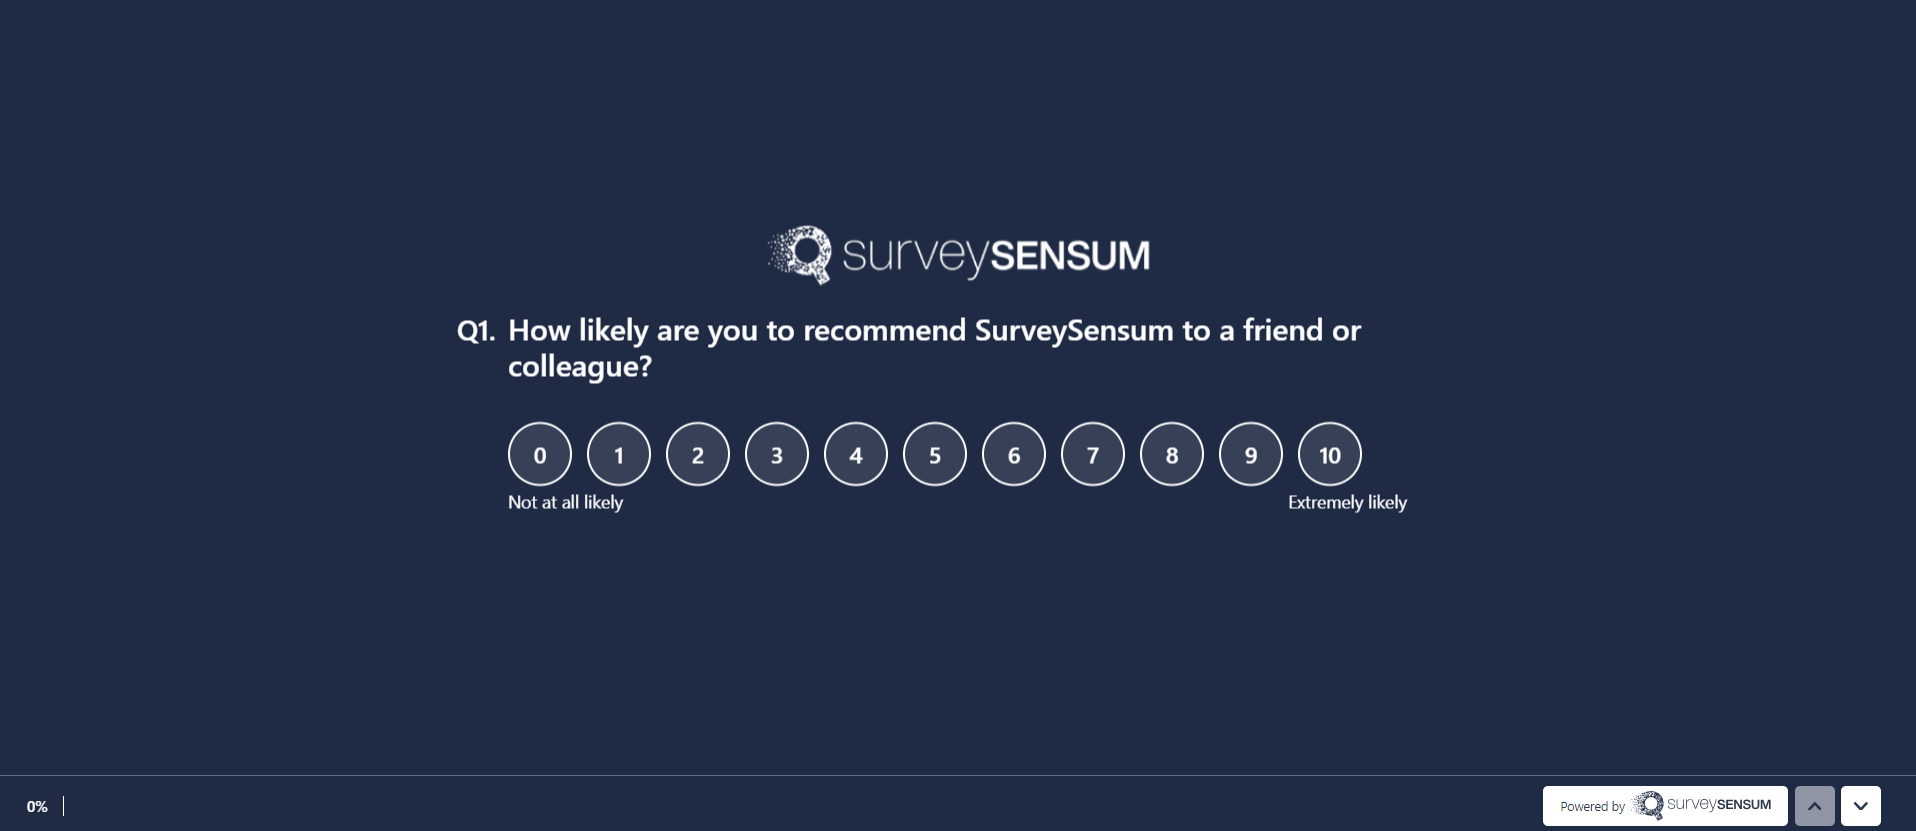
In quantitative analysis, you nudge your customers to rate your product/service or give a score, as you typically gather numerical data. For example: “How satisfied are you with our checkout process, on a scale of 1 to 10?” Once the numbers are in, you calculate an average score, maybe even compare it across time periods, and draw conclusions.
But if you also ask “What made you give this score?” to your research participants, you get responses that are unstructured in nature, i.e. each one is different in wording, detail, and tone. While quantitative analysis tools cannot process such data, you can use qualitative data analysis methods to understand why a customer gave that particular score/rating.

With that said, let’s understand these methods used for qualitative data analysis.
Qualitative Data Analysis Methods
There are different ways to analyze qualitative data based on what you want to understand in the customer feedback. Is it the tone, the theme, or simply how many times a customer uses a particular word?
Depending on that, you can apply the following qualitative methods:
1. Text Analysis
Text analysis focuses on identifying and quantifying the specific words, phrases, or ideas that show up repeatedly in qualitative data. By doing so, you can find out what your customers are talking about most and how often.
For example, let’s say you ask “What can we improve?” at the end of a post-purchase survey and you get the following answers:
- “The delivery took a lot of time.”
- “The support agent didn’t understand my issue.”
- “The delivery experience was a nightmare. Not only was my order delayed but the delivery guy was so rude.”
- “I love the product but the installation was confusing.”
You want to know how many times the customers talk about key aspects of your offering, such as “product,” “delivery,” and “support.”
With text analysis, you can easily track the frequency of these words. So, “delivery” appears three times in this dataset as opposed to “product” and “support agent” which appear only once.
This way, you can discover popular concerns among your customers and fix them first.
With SurveySensum’s AI-powered Text Analytics software, you can analyze thousands of open-ended responses in seconds and identify recurring terms! It automatically groups similar phrases together to calculate how often a phrase or a theme pops up in the feedback and gives you the percentage of their repetition.
Uncover patterns hiding in plain sight. Track what your customers say most often with SurveySensum and use those insights to take informed actions!
Free Forever • No Feature Limitation • No Credit Card Required • Sign Up For Free ![]()
2. Thematic Analysis
Thematic analysis takes text analysis a step further. It helps you understand the meaning of the feedback and identify patterns (or themes).
For example:
Imagine you ask your customers why they canceled their subscription and you receive feedback like this:
- “It just didn’t feel worth it.”
- “I wasn’t getting enough value for what I paid.”
- “Too expensive compared to [another product name]”
While all three statements can be labeled under the theme “pricing dissatisfaction,” the first two responses share a common sub-theme: customers don’t believe that the product offers enough value for the price it comes at. However, the third response suggests a lack of competitive pricing.
In short, thematic analysis allows you to go beyond surface-level insights and uncover real reasons behind customer behavior.
3. Narrative Analysis
Narrative analysis looks at the entire response as a whole. It does not break down feedback into themes or labels. Instead, it zeroes in on how the customer structures their experience, what they emphasize, and how the story unfolds.
Here’s an example:
“I was excited to try your product. While everything was smooth at first, the app started crashing right after a few days. I tried reaching out to customer support but it didn’t work. I waited for a few days, tried some troubleshooting based on online tips, but then I just uninstalled the app.”
The above response is not just a complaint, but it narrates a complete user journey. The user shares a timeline of their experience, from initial excitement to eventual frustration and churn. Each stage in this story gives you a clue: while the onboarding was fine, the technical issues and lack of support drove the user away.
By performing narrative analysis, you can get to the bottom of not only what happened but how it happened. And most importantly, from the customer’s perspective.
4. Discourse Analysis
Discourse analysis emphasizes the language, tone, and phrasing that customers use to express themselves, giving detailed insights into human behavior. Are they angry, sarcastic, passive-aggressive, or hopeful? Do they speak formally or casually? Are they framing themselves as victims or partners?
Understanding these nuances helps you decode the feedback more precisely and allows you to meet customers in a way that fits their context.
For instance, a customer leaves a review: “The customer support should have kept me updated. It’s not my job to chase it.”
Applying this method, you will focus on words like “should have,” “not my job,” and “chase” which clearly suggest that the company has failed to meet a basic level of service. They reflect the customer’s assertive and confrontational tone, showing that the customer is not just disappointed but frustrated with customer support.
5. Grounded Theory
Grounded theory is essentially a qualitative research method. It’s different from the four methods that we’ve discussed so far.
Here, instead of approaching the feedback with predefined themes or assumptions, we let meaningful insights emerge directly from the data collected.
For instance, let’s say you’re analyzing feedback from a customer satisfaction survey for a ride-sharing app and you come across this response:
“The app usually freezes when I try to book a ride between 5-7 PM.”
If you perform thematic analysis on this, you’ll approach it with a predefined theme. Maybe you’ll want to know whether this response falls under the theme “software glitches” or “booking ride feature.”
However, in grounded theory, you don’t squeeze feedback into any fixed theme. Instead, you allow the nuance in the data to surface new ideas. For the example above, it could be the theory that the tech is unreliable, specifically during high demand.
To put it simply: Instead of testing a predefined assumption, you build your understanding from the bottom up using real-world data in grounded theory.
6. Sentiment Analysis
In sentiment analysis, you classify feedback as positive, negative, or neutral. This helps you understand how customers feel about specific experiences or aspects of your business.
For example, imagine two customers leaving this feedback:
- Customer 1: “The support team solved my issues in minutes.”
- Customer 2: “Support took forever to respond and wasn’t helpful.”
While both customers are talking about the same team, their emotional intent varies (customer 1 is praising; customer 2 is complaining).
Sentiment analysis breaks down this polarity to dissect the emotion behind what was said. As a result, you can identify whether customers are becoming happier or more frustrated over time, how emotions vary across touchpoints, and which areas consistently evoke negative sentiment.
Note: Sentiment analysis differs from discourse analysis, which focuses on the style and structure of expression (or how the customers frame their message). While sentiment analysis zeroes in on the feeling being conveyed.

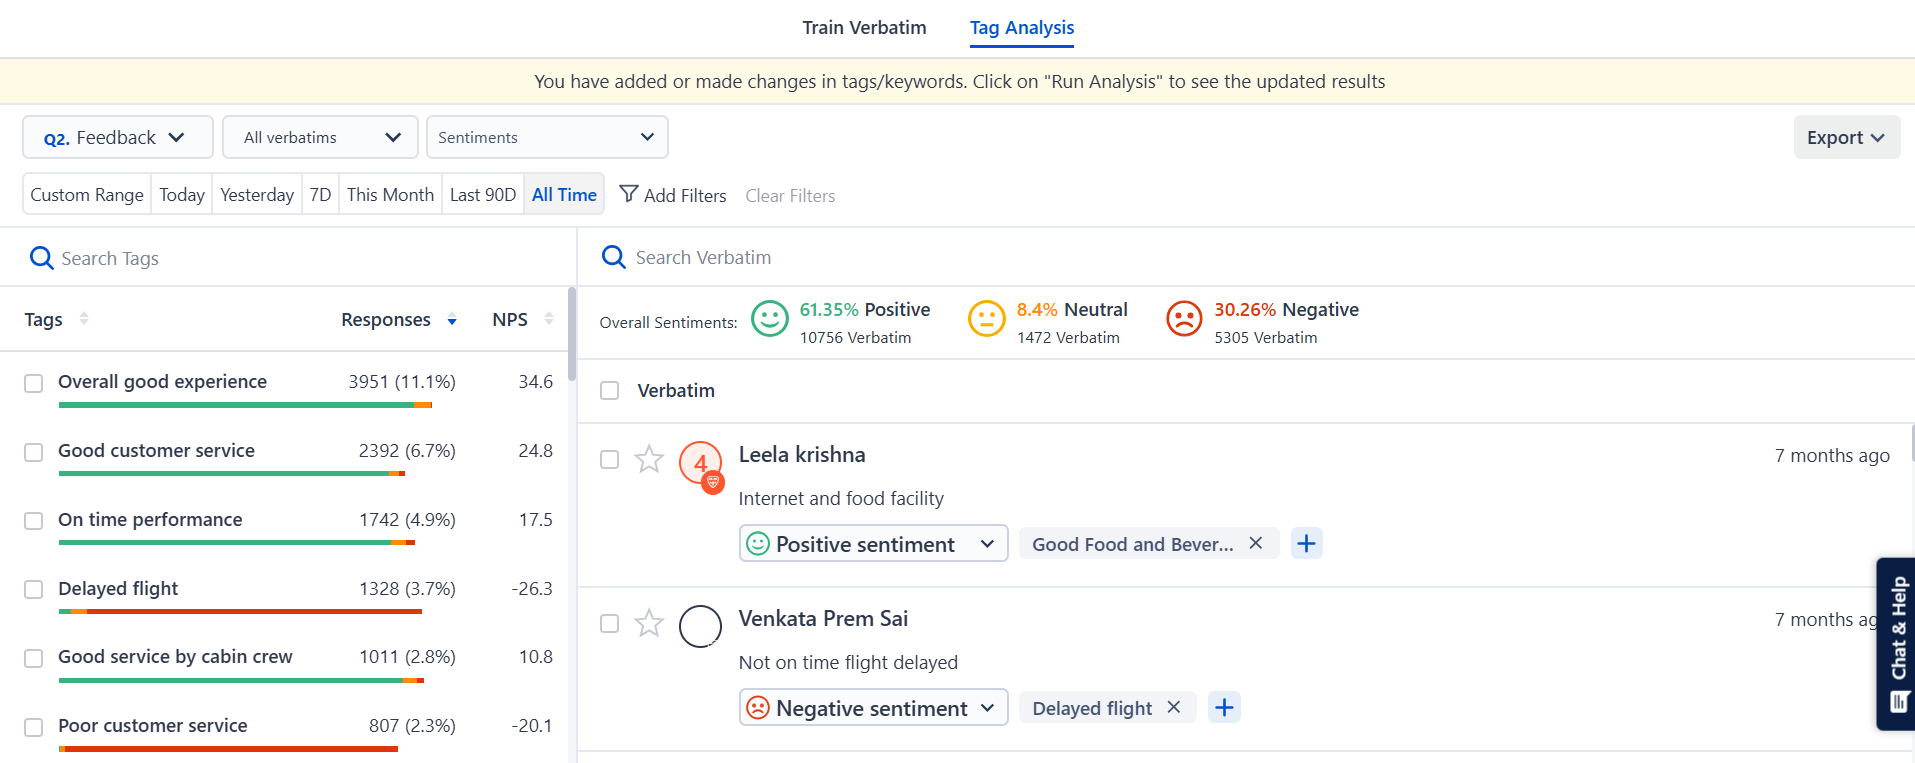
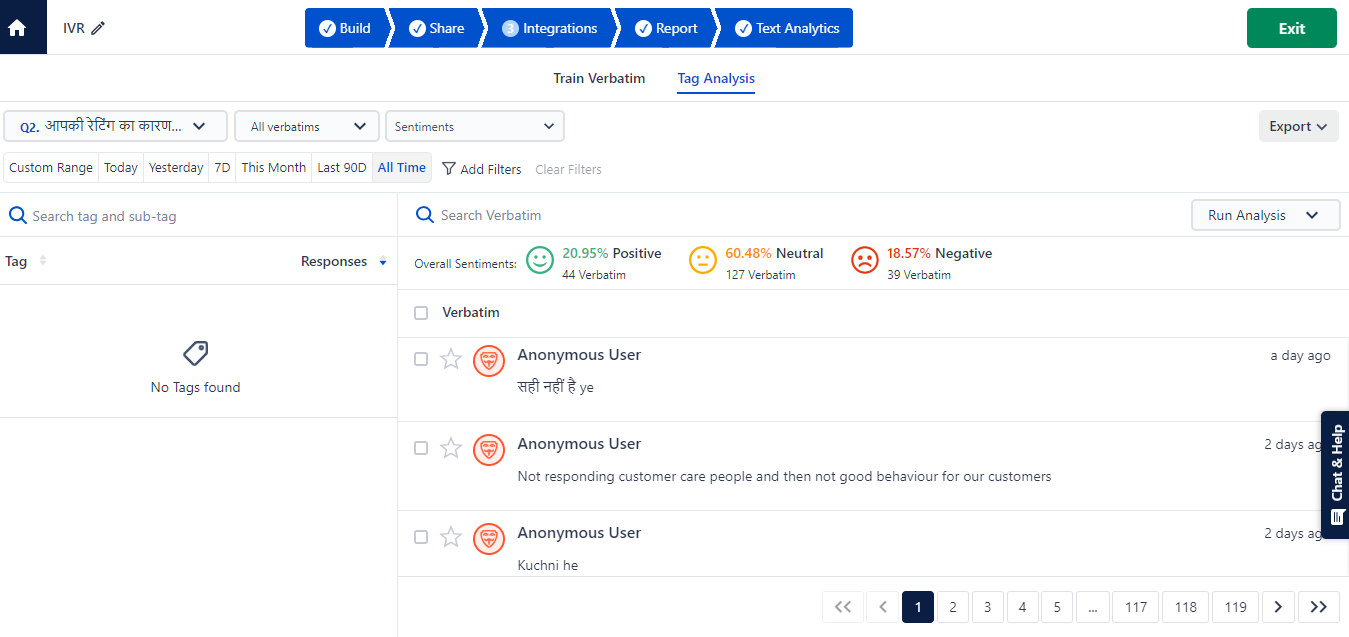
SurveySensum’s AI-driven sentiment analysis instantly detects how your customers feel, automatically tagging responses as either positive, negative, or neutral. You can filter by sentiment to pinpoint exactly which issues make your customers happy or frustrated (and to what extent).
Can’t tell if a customer is happy or upset? SurveySensum lets you understand customer sentiment and track how their feelings change over time.
Free Forever • No Feature Limitation • No Credit Card Required • Sign Up For Free ![]()
Now, let’s learn how to analyze qualitative data.
How to Do Qualitative Data Analysis: 5 Steps
Qualitative data analysis includes five key steps: gathering, organizing, coding, analyzing, and reporting on the data.
Let’s explore each in detail.
Step 1: Gather Your Qualitative Data
Feedback rich in information — that’s what you need for a successful qualitative analysis. If the feedback isn’t meaningful, the insights won’t be either.
Below, we’ve explained three ways to gather quality input:
- Classic Methods: The easiest way to collect customer feedback is to ask directly. This could be through an open-ended survey, a 1:1 interview, or a focus group. Although the key is to ask the kind of research questions that invite detail. For example, instead of asking, “Were you satisfied with your experience?”, go with “What worked well for you, and what didn’t?”
- Leverage Existing Feedback: Before you create a new survey or a focus group, take a closer look at the feedback your research team is already sitting on. There’s plenty of data to utilize — customer support tickets, live chat transcripts, call center notes, in-app feedback forms, product reviews, app store comments, etc.
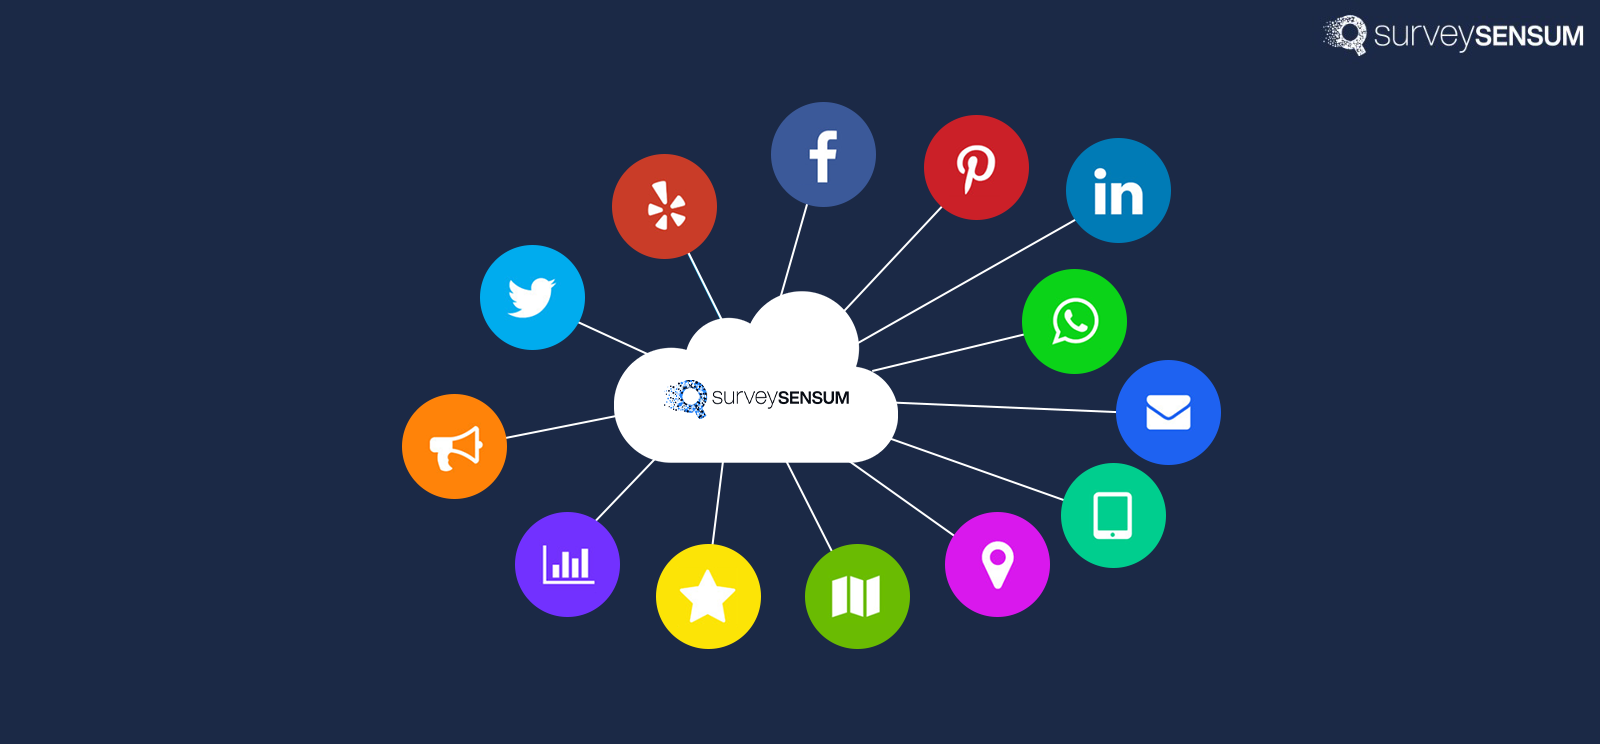
- Explore Untapped Data Channels: Monitor social media mentions, DMs, online communities or user forums, podcast reviews, etc. These channels constitute real opinions that people share voluntarily. You can set up social listening tools or simple manual checks (if you’re a small business) to capture this feedback.
Step 2: Organize Your Qualitative Data
Non-numerical data is messy. You’ve got survey answers, social media comments, complex interview data, and whatnot. Needless to say, it’s important to structure this data before you process it.
Here are two common methods for data management:
1. Manual Organization
It’s best to sort everything manually if you’re working on a small dataset that comes from a single source.
For example, 100-200 responses were collected from a customer satisfaction survey. Copy-paste all the responses into a single Excel or Google Sheet with details like customer name, age, gender, region, etc.
Additionally, you can split long responses into bullet points for easier reading.
2. Feedback Analytics Platforms
With these platforms, you can analyze as well as organize customer feedback. For example, SurveySensum’s Text Analytics software leverages AI to auto-sort feedback into logical themes or topics as the data comes in. The entire feedback is stored in one place, which makes filtering the feedback and searching for anything in it easy. You can also access past feedback across departments or projects without scratching your head.
Struggling to keep up with all your customer feedback data? Shift to SurveySensum — where every piece of feedback is stored, sorted, and ready to use — right when you need it.
Free Forever • No Feature Limitation • No Credit Card Required • Sign Up For Free ![]()
Step 3: Code Your Qualitative Data
Once your data is organized, it’s time to code it. This means labeling and sorting data based on themes.
You can either code feedback manually or use an AI coding assistant. Below, we’ve explained both these methods:
1. Manual Coding Techniques
To code manually, you need to go through each response and tag it with short, meaningful labels (called “codes”) that describe what the customer is talking about.
For example, consider this feedback: “The delivery was late, and no one from support responded to my messages.”
You might assign two codes here: “Late Delivery” and “Poor Support Communication”
As you go through more feedback, you can add new codes or refine existing ones. Once you’re done, review all the codes to make sure they’re consistent and that they reflect the actual problems or themes that keep coming up.
Pro Tip: Use columns in Excel or Google Sheets to separate the customer response, its corresponding code(s), and notes for context. It’s simple but effective — and works well for small datasets.
2. Automated Coding Solutions
AI-powered platforms offer a smarter and faster way to code large volumes of qualitative data. With these tools, you can completely automate the coding process and ensure consistency.
Here’s a peek into what you can automate using a thematic analysis platform:
- Identifying repeating themes, ideas, or issues
- Assigning smart labels to each piece of feedback
- Applying existing tags at scale (you can simply upload your codebook)
- Clustering similar responses together
- Recognizing variations in feedback that do not affect the overall meaning
- Flagging vague or uncategorizable data
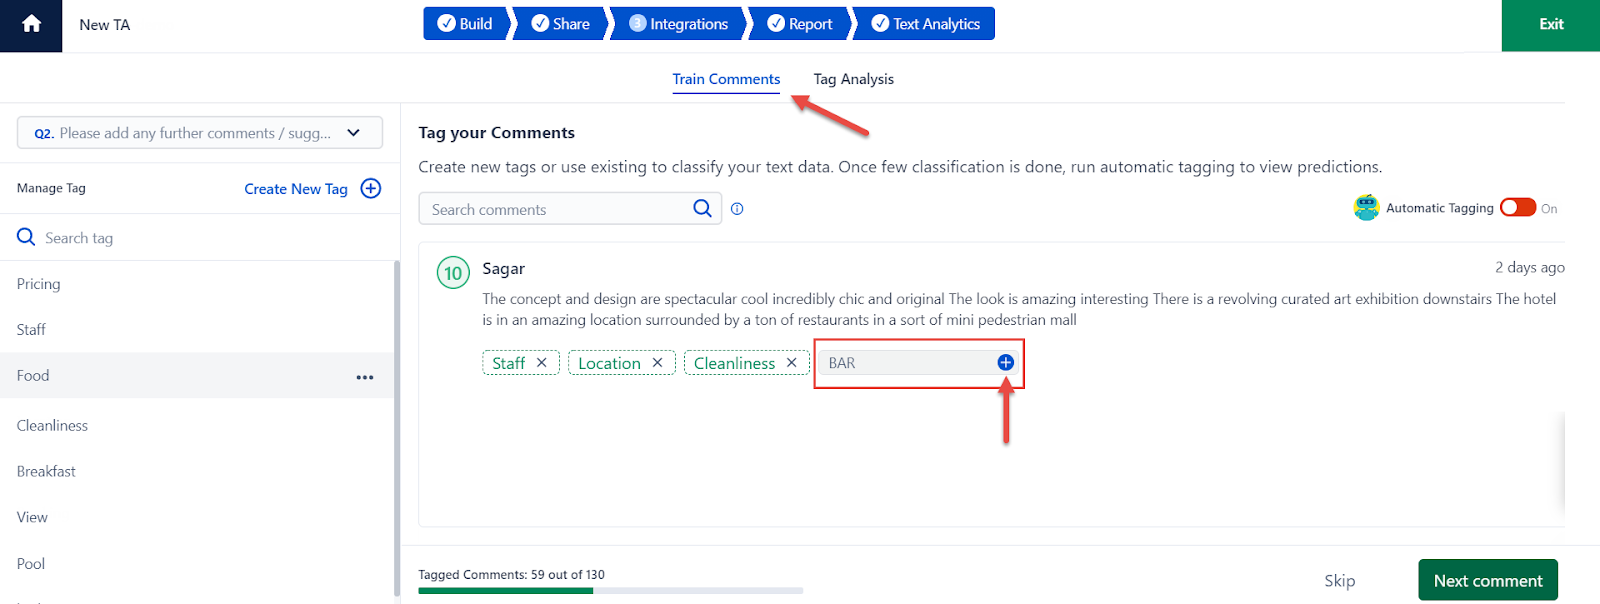
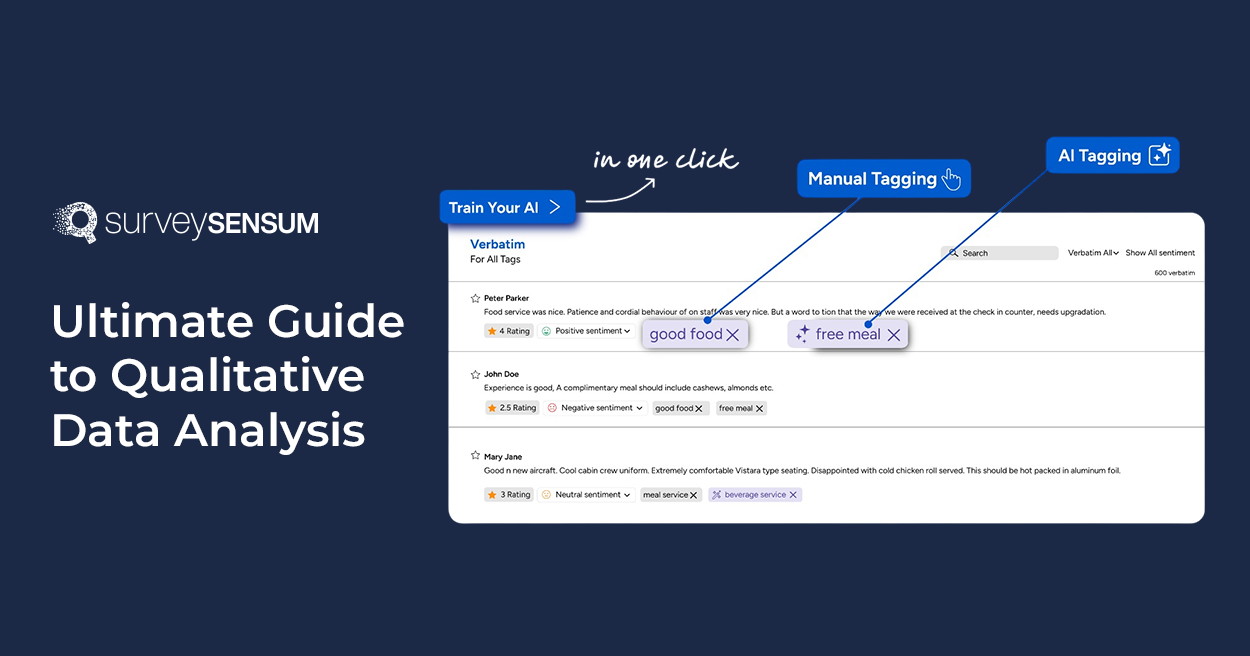
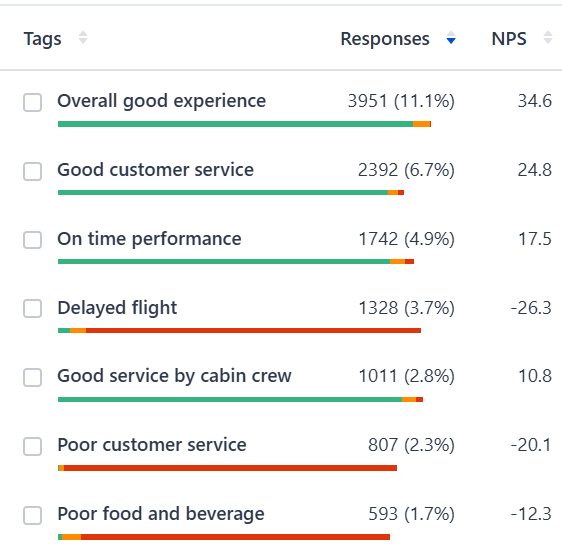
SurveySensum helps you code responses at scale — automatically as well as manually. You can create and apply these tags, which are visible to everyone on your team (because consistency matters). What’s more, you can filter your feedback by tag, track how often each tag appears, and even link them to sentiment scores or key metrics like NPS.
Code smarter, code faster with SurveySensum’s AI-driven coding process! It automatically identifies key ideas in customer comments and suggests relevant tags based on recurring themes, sentiment, or your business logic.
Free Forever • No Feature Limitation • No Credit Card Required • Sign Up For Free ![]()
Step 4: Analyze Your Data for Insights
Now comes the fun part: looking deeper into the patterns of what’s been tagged. This calls for:
1. Creating Sub-codes
While primary codes help organize the responses, it’s the secondary or sub-codes that offer nuance into what exactly the customer means by a response.
For example, suppose you’re tagging feedback under the general code “Mobile App Experience.” As you dig deeper, you notice patterns — some users are frustrated with slow loading, others with confusing navigation, and a few mention login issues. These can become sub-codes like “Loading Time,” “Navigation,” and “App Login.”
This gives your analysis more depth and structure.
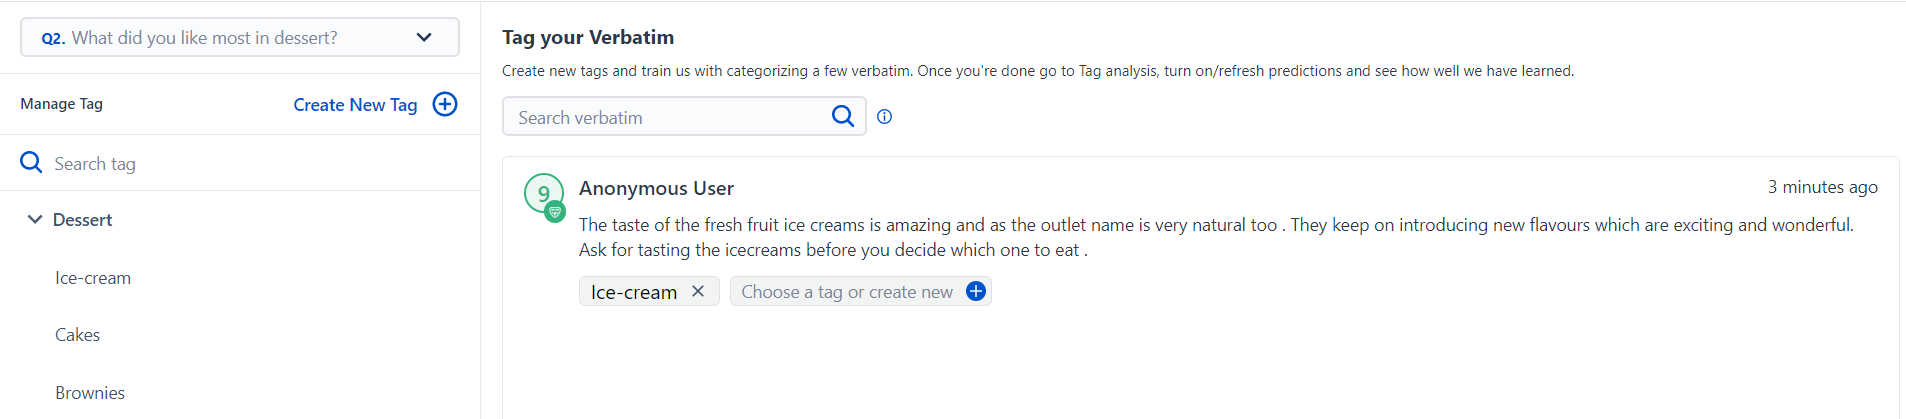
SurveySensum allows you to create sub-tags for more accurate insights. For example, if numerous responses mention “Desserts,” you can break that down into sub-tags like “Ice Cream,” “Cakes,” and “Brownies”. If a response contains the sub-tag, it is automatically linked to its parent tag. It’s a simple yet effective way of structuring complex qualitative feedback without losing nuance.
2. Correlating Codes with Customer Segments
You must understand that what’s important to one customer segment might not be important to another.
For example, many customers report “slow response time.” But if you correlate it with customer segments, you find that it’s only mentioned by overseas customers. Thus, it’s not that you’re generally responding slowly, but there’s a timezone-based support delay that needs to be fixed.
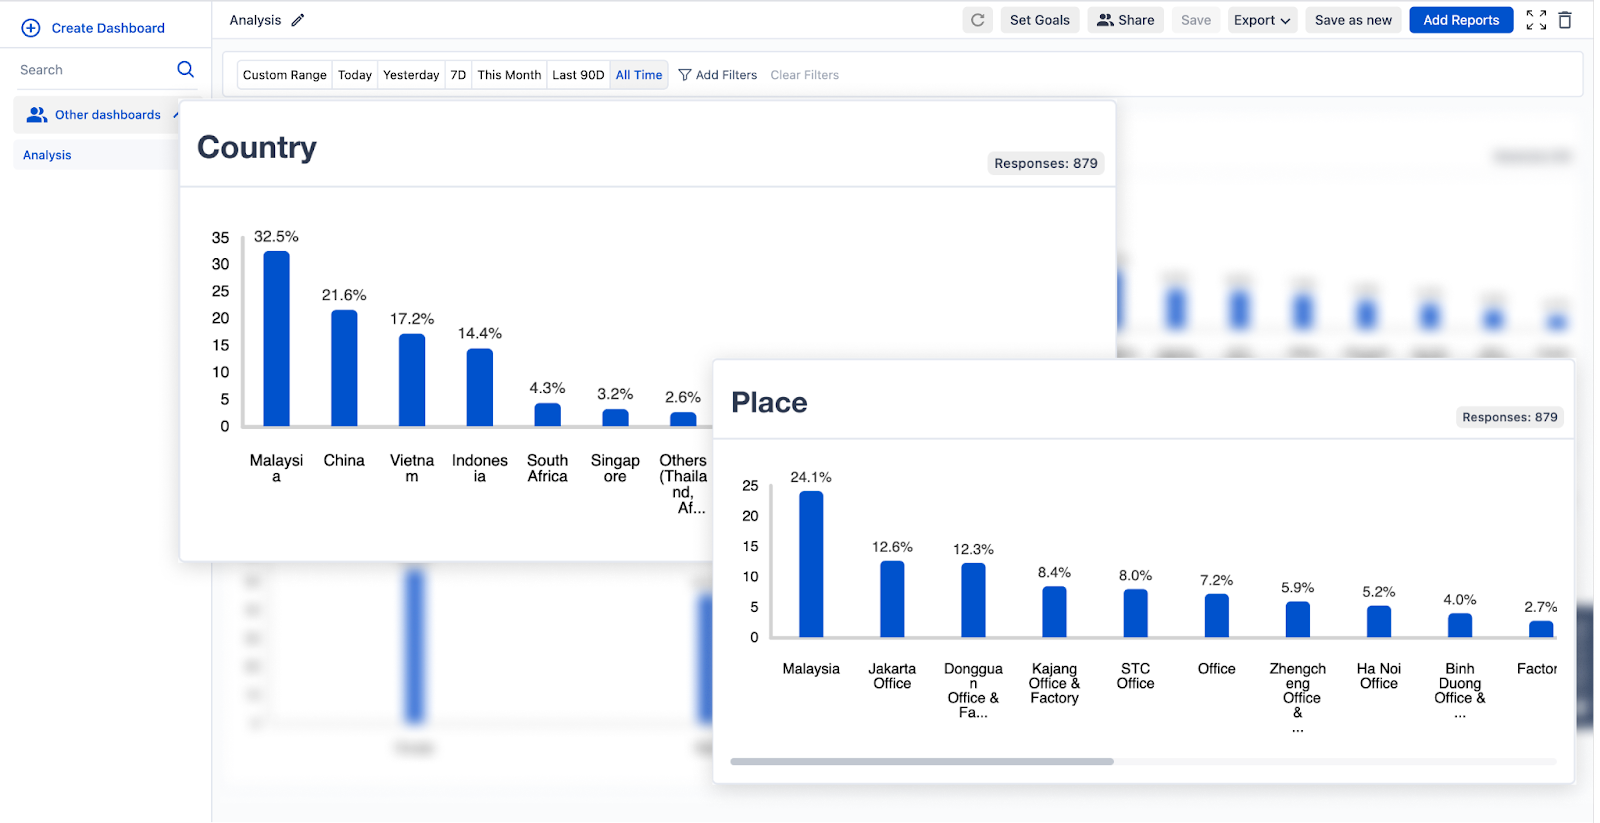
SurveySensum enables you to analyze and filter textual data across various customer segments such as region, product line, customer tier, etc. By examining at such a granular level, you can tailor your strategies for different groups of customers and identify low or high-performing areas at a glance.
Use SurveySensum to understand and act on specific feedback trends across different customer segments today!
Free Forever • No Feature Limitation • No Credit Card Required • Sign Up For Free ![]()
3. Visualizing Coded Data
The first thing that businesses visualize is the frequency of codes (how often each theme shows up). While that’s a good starting point, it’s not enough.
You must also:
- Measure Impact: To make your analysis truly useful, ask: How is this issue impacting our key metrics like CSAT, NPS, or CES? For example, if “poor customer service” is a common theme and customers who mention it have much lower CSAT scores than others, then that theme is pulling your score down and needs immediate attention.
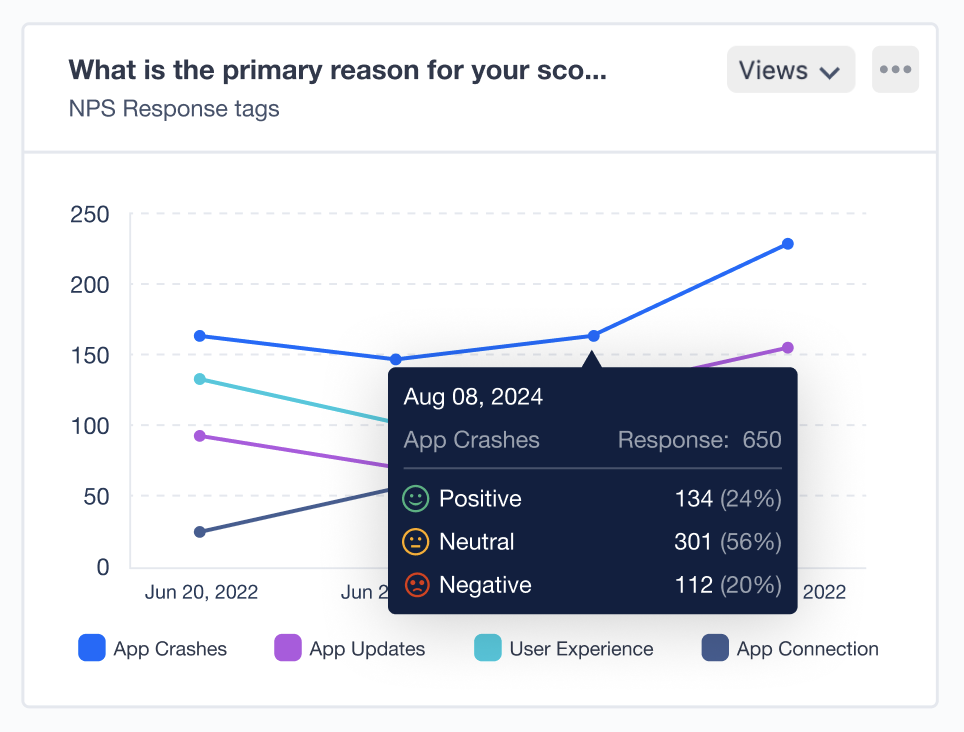
- Analyze Code Trends Over Time: Look at how the importance of a theme shifts over time. So, if you’ve recently launched a new app feature, and you notice that mentions of “app crashes” have gone up this month — that’s a signal. Thus, by comparing these patterns month-over-month or quarter over quarter, you can connect trends in feedback with changes in your service, product, or processes.
4. Leveraging Text Analytics Tools
Reading, coding, and analyzing hundreds of open-ended responses at scale is a huge waste of time. At this stage, ai tools for data analysis help structure unstructured feedback, surface recurring patterns, and support qualitative insights at scale.
SurveySensum’s AI-powered text analytics software automates the entire process of analyzing qualitative data. You can easily:
- Identify and understand the language that the customer uses in the feedback
- Break down unstructured data into smaller pieces for a quick analysis process
- Group similar phrases into meaningful themes
- Track how a theme behaves across different segments/channels/periods
- Detect shifts in customer sentiment (positive, negative, neutral)
- Track whether a theme/topic is gaining traction or fading out
- Prioritize issues based on both the volume and the emotional weight of mentions
Step 5: Report on Your Data
The final step is to package your findings into a format that’s easy to understand and act on. This requires:
1. Creating Visual Reports
PowerPoint is a great tool for creating structured presentations using visual aids like bars, charts, and graphs. All the more if you’re working with a small volume of feedback.
But if you want deeper and high-volume analysis, SurveySensum offers robust data visualization tools. It automatically provides a breakdown of key trends using journey-based reports to understand the “why” behind every feedback. You can visualize segment-wise variations, theme intensities, sentiment changes, as well as theme vs metric analyses.
Stop piecing insights together manually. With SurveySensum, you can create focused reports that track key shifts, spotlight troubled areas, and keep every stakeholder aligned.
Free Forever • No Feature Limitation • No Credit Card Required • Sign Up For Free ![]()
2. Presenting Your Narrative
The impact of your presentation relies equally on the facts you present and how you present them.
Here are some best practices to tell your story with the analyzed data:
- Always start with the biggest takeaway to immediately grab everyone’s attention.
- Tie your findings back to business metrics such as churn, CSAT, NPS, and conversion rates.
- Use detailed, actionable headlines for your slide. For example, instead of using “Support Delay Analysis,” write “Support Delays Drove 42% of Detractor Feedback.”
- Make sure your speech is not simply a repetition of what’s on the screen. Humanize that data and add emotional weight.
- Don’t dilute your story. If you’ve got 20 themes, choose the top 5 to present so that you don’t bore the listeners.
- Every report must close with a slide on what the team should do next.
- Keep visuals simple and actionable.
And that wraps up the process of analyzing qualitative data. However, it is important to acknowledge that QDA has its own set of challenges, which we’ll explore next.
Challenges of Qualitative Data Analysis
- Difficulty in Maintaining Objectivity: When you’re constantly reviewing customer feedback, it’s easy to interpret comments in a way that fits your team’s assumptions. This unintentional bias can cloud your judgment, leading to decisions that miss the real issue.
- Ambiguous or Multi-layered Responses: Customers often give feedback that’s both positive and negative in the same breath. For example, someone might love your product but be frustrated with the returns process. If you don’t capture both of these aspects accurately, you risk reacting to just part of the story and solving the wrong problem.
- Volume Overwhelms Depth: Nuance can be easily lost when you have to deal with thousands of open-ended responses. Many businesses create broad categories to simplify their workload, which actually flattens the customer experience. This is because they exclude minor but significant themes that might hold the key to valuable insight.
As challenging as this sounds, every business must invest in qualitative data analysis. Let’s see why.
Benefits of Qualitative Data Analysis
- Deeper Insight Into How Your Metrics Work: Quant surveys only measure what you ask. So, you’re aware of NPS dipping from 58 to 49 but not of the reason(s) that influence it. However, analyzing open-ended feedback points to specific drivers and adds narrative context.
- Realizing Pain Points You Didn’t Know Existed: Qualitative data brings in unprompted feedback that often contains problems you never considered. For example, emotional frustration, cultural gaps, edge-case bugs, etc.
- Tailoring Actions Per Segment: Effective coding can help you understand the user behavior, pain points, and preferences of each segment. For example, SMBs want a more affordable pricing model, while enterprises complain about support response times.
- Understanding Emotion and Tone: Qualitative feedback reveals a customer’s voice. It’s a reflection of how they experience your brand — whether they’re frustrated, disappointed, happy, or confused. These emotional layers offer clues about the urgency and the potential impact of the issue.
There’s no doubt that qualitative data analysis is valuable. But how can we make the QDA process more efficient and powerful? Read below!
Integrating Automation with Human Insight
The sole aim of qualitative data analysis is to capture why your customers feel a certain way, so that you can understand their needs better. Yes, automated tools can get you there faster, but it’s the human expertise and judgment that make this process all the more efficient.
SurveySensum’s AI Text Analytics software is built with this balance in mind.
It automates the heavy lifting — sorting and tagging customer feedback, identifying themes, analyzing sentiment, etc., — while giving you full control to review and add context.
Thus, you can rename or modify any theme that AI detects, add new themes based on your understanding, create your own hierarchy of sub-themes to reflect the depth of feedback, and even adjust sentiment classifications.
Don’t trade control for speed. SurveySensum lets you stay in charge while AI handles everything — gathering, organizing, tagging, analyzing, and visualizing your qualitative feedback.
Free Forever • No Feature Limitation • No Credit Card Required • Sign Up For Free ![]()
FAQs
1. What is qualitative data analysis, and why is it important?
Qualitative data analysis helps you understand the meaning behind non-numerical customer feedback. For example, why customers are unhappy or what they expect from your brand. This is important because it reveals customer emotions and motivations that ratings or scores alone can’t explain.
2. Can AI really help with qualitative data analysis?
Yes, AI algorithms can quickly process large volumes of text data, cluster similar phrases, automatically tag or code feedback, analyze the emotional tone of the text, and identify recurring patterns/themes. This not only saves time but also makes the analysis more consistent.
3. What are the six methods for qualitative data analysis?
The six common methods for QDA are:
- Text Analysis: Focuses on the frequency of certain words or ideas
- Thematic Analysis: Identifies repeating patterns or themes across responses
- Narrative Analysis: Looks at the narrative structure of the feedback to understand the customer’s experience
- Discourse Analysis: Examines how language is used in context
- Grounded Theory: Helps develop new theories based on the data instead of starting with a pre-existing one
- Sentiment Analysis: Tells you what your customers feel based on the tone and content of the feedback
4. What’s the best way to present qualitative insights to stakeholders?
Use visual summaries like word clouds, bar charts, or theme-over-time graphs to present qualitative insights to your stakeholders. Platforms like SurveySensum offer AI-generated reports and customizable dashboards that help you showcase your findings clearly.
Make sense of what your customers are saying — at scale. Use SurveySensum’s AI-enabled Text and Sentiment Analytics software to analyze open-ended feedback and rightly act on it.
Free Forever • No Feature Limitation • No Credit Card Required • Sign Up For Free ![]()

Increase ROI by 3x with targeted feedback & analysis
Boost Customer Satisfaction by up to 20%
Reduce Churn by identifying pain points in real time
See it in Action
Contents
How much did you enjoy this article?