Request a Demo
Did you know that 1 in 3 customers will walk away from your brand after just one poor experience? To make matters worse, 13% will tell 15 or more people about that bad experience.
That’s a steep price to pay for not knowing what went wrong.
Remember this: If you’re always waiting to see the churn report or a drop in your CSAT to take some action, it’s already too late. The only way to prevent that kind of fallout is to understand what your customers are experiencing while they’re experiencing it.
That’s exactly what a customer experience survey helps you to do.
So, let’s break down CX surveys and get you ready to design and launch one. By the time you finish this, you’ll have a clear picture of what questions to ask, how to structure your survey, and how to analyze the results.
What is a Customer Experience Survey?
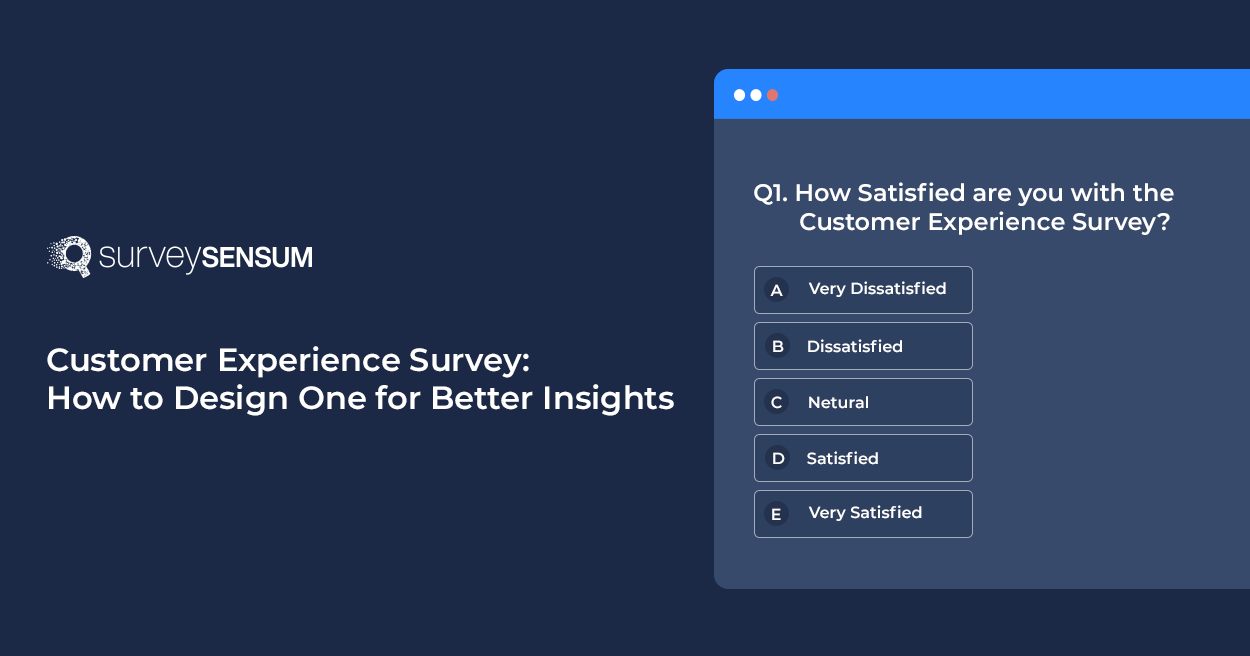
A customer experience survey is a type of Voice of Customer survey that helps you gather feedback from customers to understand how they perceive your brand.
For instance, let’s say a customer just finished a support call. You send them a short survey asking how helpful the customer service representative was, how easy it was to get support, and whether their issue was resolved. This is a CX survey.
Now, let’s see why businesses must use them.
Why Use Customer Experience Surveys?
Most businesses are good at tracking what customers do, but very few know how those customers feel as they do it. Customer experience surveys bridge this gap.
Here’s what you gain from using CX surveys:
1. A Chance to Act When It Still Matters
Most businesses spot issues by the time it’s already too late — either the customer has churned or left a scathing review online. In short, the damage is done.
What makes CX surveys powerful is that they help you identify pain points early, at the exact moment a customer feels friction.
Example: A SaaS company introduces a post-onboarding survey to gather customer feedback on how smooth the onboarding experience was. This way, they can surface friction in real time and act on the issue before the customer disappears.
2. Reduced Silent Churn
Did you know that 96% of unhappy customers never complain? And 91% of them simply leave!
So, yes, silent churn is very much real. And without a proper CX survey in place, these quiet exits are likely to go unnoticed. What’s worse: the root cause is never identified, meaning it continues to negatively impact the experience for other customers.
NPS is particularly useful in the retail industry because it helps businesses build customer loyalty, retain loyal customers, and encourage them to refer others.
Example: Customer retention metrics for your app show users dropping off over the last two weeks, but you have no clue why. An in-app voice of customer survey reveals the culprit: your latest UI update made key features clunky.
3. Deeper Understanding of What Actually Drives Long-Term Customer Loyalty
When you know why customers love you (or why they might leave), you can focus your efforts on strengthening those positive touchpoints. CX surveys offer insights into what the customers prefer, helping you build even stronger relationships.
Example: An online learning platform uses CX surveys at key stages — like after users complete a module or graduate from a course — to understand what truly motivates its users. When a customer feedback survey revealed that a strong sense of community drives customer loyalty, the platform then invested in features like live interactions and moderated forums to build that connection.
4. Clarity on Where to Invest Your Time and Budget
Every team has a limited number of hours, dollars, and people. CX surveys help you decide where those should go by highlighting what matters most to your customers, not what’s most convenient internally.
Example: Imagine two issues — one is a slow-loading dashboard and the other is a minor visual bug. Your CX survey shows that 60% of users mention the dashboard speed as their primary frustration. Now you have actionable data to shift your focus to the issue that actually matters the most (and confidence in doing so).
5. Tangible Returns on Your CX Initiatives
It’s one thing to feel like your customer experience is getting better, but another to prove it.
This is where customer experience surveys shine. By collecting feedback before, during, and after specific improvements in customer experience, you can justify the shifts in your CX metrics and quantify your effort.
Example: A fashion brand revamps its in-app help section and introduces a new chatbot. Before this change, a customer feedback survey revealed a low CES score for users seeking help. However, after launching the new resources, the survey shows a significant increase in CES, indicating users find it much easier to get assistance now.
Scroll down to learn how to design a CX survey.
How to Design a CX Survey?
Designing an effective customer experience survey entails more than picking a few questions and hitting “send.” Your survey should be intentional — it should capture insights that are accurate, reliable, and actionable.
Follow this step-by-step guide to design the perfect customer experience survey:
Step 1: Identify Your Objective and Customer Touchpoint to Measure
Before you open any online survey tool, ask yourself: What do I want to understand or improve through this survey?
- Are you trying to figure out whether new users are able to navigate your onboarding flow without confusion?
- Do you wish to understand why customer retention has dropped in a specific region?
- Or maybe you want to validate whether your support team is resolving tickets efficiently?
Each of these objectives requires a different kind of customer experience survey that will have different questions, target audience, CX metrics, etc.
Once you know your objective, map it to the right customer touchpoint. This is the moment in the customer journey when you’ll gather customer feedback.
You can refer to the table below to understand which customer touchpoint to target (or when to survey customers) based on your objective:
| Customer Touchpoint | Objective of the CX Survey at This Touchpoint |
| Pre-Sale (Awareness & Consideration) | How clear your message is, what questions potential customers have, and what influences their purchasing decisions. For example, students in the awareness stage often compare options like AP classes to decide their academic path, which directly impacts how they engage with education-focused services. |
| Onboarding | How easy it is to get started, if they understand your product, and initial satisfaction |
| Post-Purchase (Transactional) | How smooth the buying/delivery process was |
| Product or Service Usage | How easy and useful your product/service is, if the features are helpful, and overall customer satisfaction during normal use |
| Customer Support Interaction | How fast and helpful your support team was, and whether the customer’s problem was solved |
| Feature Release or Product/Service Update | If people are using the new feature/product/service, how easy is it to use, and if they like it |
| Contract Renewal | Why a customer might stay or leave, if they feel they’re getting good value |
| Account Closure | The exact reasons why a customer is leaving |
Step 2: Define Your Audience
The next step is to figure out who to send the survey to.
Heads-up: It’s not always as obvious as “send it to everyone who bought from us.” You want to hear from people who’ve directly experienced the moment you’re trying to measure.
For example, if you’re surveying post-purchase satisfaction, then the survey should only go to customers who actually completed a transaction in the last 24-48 hours, not someone who made a purchase 7 days ago.
Also, Don’t Forget to Segment Your Audience
Imagine you have an average CSAT of 4.3/5. That seems good on the surface, right? But when you segment that data, you suddenly realize a critical difference: your enterprise users consistently rate you at 4.7, while your SMB (Small and Medium Business) users average a much lower 3.8.
The point is: Customer experience varies across different segments and customer journeys. If you treat everyone the same, you’ll miss critical patterns.
So, make sure you segment your audience by factors like behavior, lifecycle stage, geography, account size, etc. This will help you tweak your customer survey for each segment and capture insights specific to it.
→ For enterprise needs, a powerful platform is key. See how a modern tool stacks up against a traditional giant in our SurveySensum vs Qualtrics analysis.
Step 3: Identify the Right CX Metric for Your Survey
A CX survey can serve two main purposes:
- Capture a CX metric: This means the survey’s primary role is to collect the data needed to calculate a specific score, like your Net Promoter Score or Customer Satisfaction score.
- Understand why a CX metric is changing: The survey aims to uncover the reasons behind a shift in a CX metric you’re already tracking (e.g., why your churn rate has been increasing).
Therefore, it’s critical to decide on the right CX metric first, as this directly dictates how you build your survey.
Below is a breakdown of the most commonly used CX metrics:
| CX Metric | What It Measures | How a CX Survey Helps | Use Case Example |
| Net Promoter Score | Customer loyalty and how likely they are to recommend you. | Calculates NPS; Finds out who loves you (promoters), who’s neutral (passives), and who’s unhappy (detractors) | Send an NPS survey to customers 3 months after they sign up to see if they’ll likely renew. |
| Customer Satisfaction | How satisfied customers are with a specific experience or interaction. | Calculates CSAT score; Gets immediate feedback on a recent event | Trigger a CSAT survey right after delivery to ask about shipping speed and delivery experience. |
| Customer Effort Score | How easy or hard it was for a customer to complete a task. | Reveals exactly where customers are struggling in a process | Use a CES survey after an online loan application to see how smooth the application process was. |
| Customer Churn Rate | The percentage of customers who stopped using your product/service. | Highlights the real reasons why people leave | Send a churn survey if you’re seeing rising account closures or cancellations to understand the deal-breaker. |
| Goal Completion Rate (GCR) | Measures the percentage of users who complete a specific goal or desired action. | Helps understand if customers are achieving key objectives you set for them and where they might be dropping off. | If an app’s “Add to Cart” goal completion rate drops, an in-app survey at that stage helps understand the blocker. |
| First Contact Resolution (FCR) | Whether a customer’s issue is fully solved during their first contact with support. | Measures support efficiency and quality | After a support interaction, a post-contact survey asks, “Was your issue resolved on this first contact?” to measure FCR. |
Step 4: Use the Right Types of Questions in Your Survey
There are different types of questions you can ask in a customer experience survey. These are:
1. Rating Scale Questions
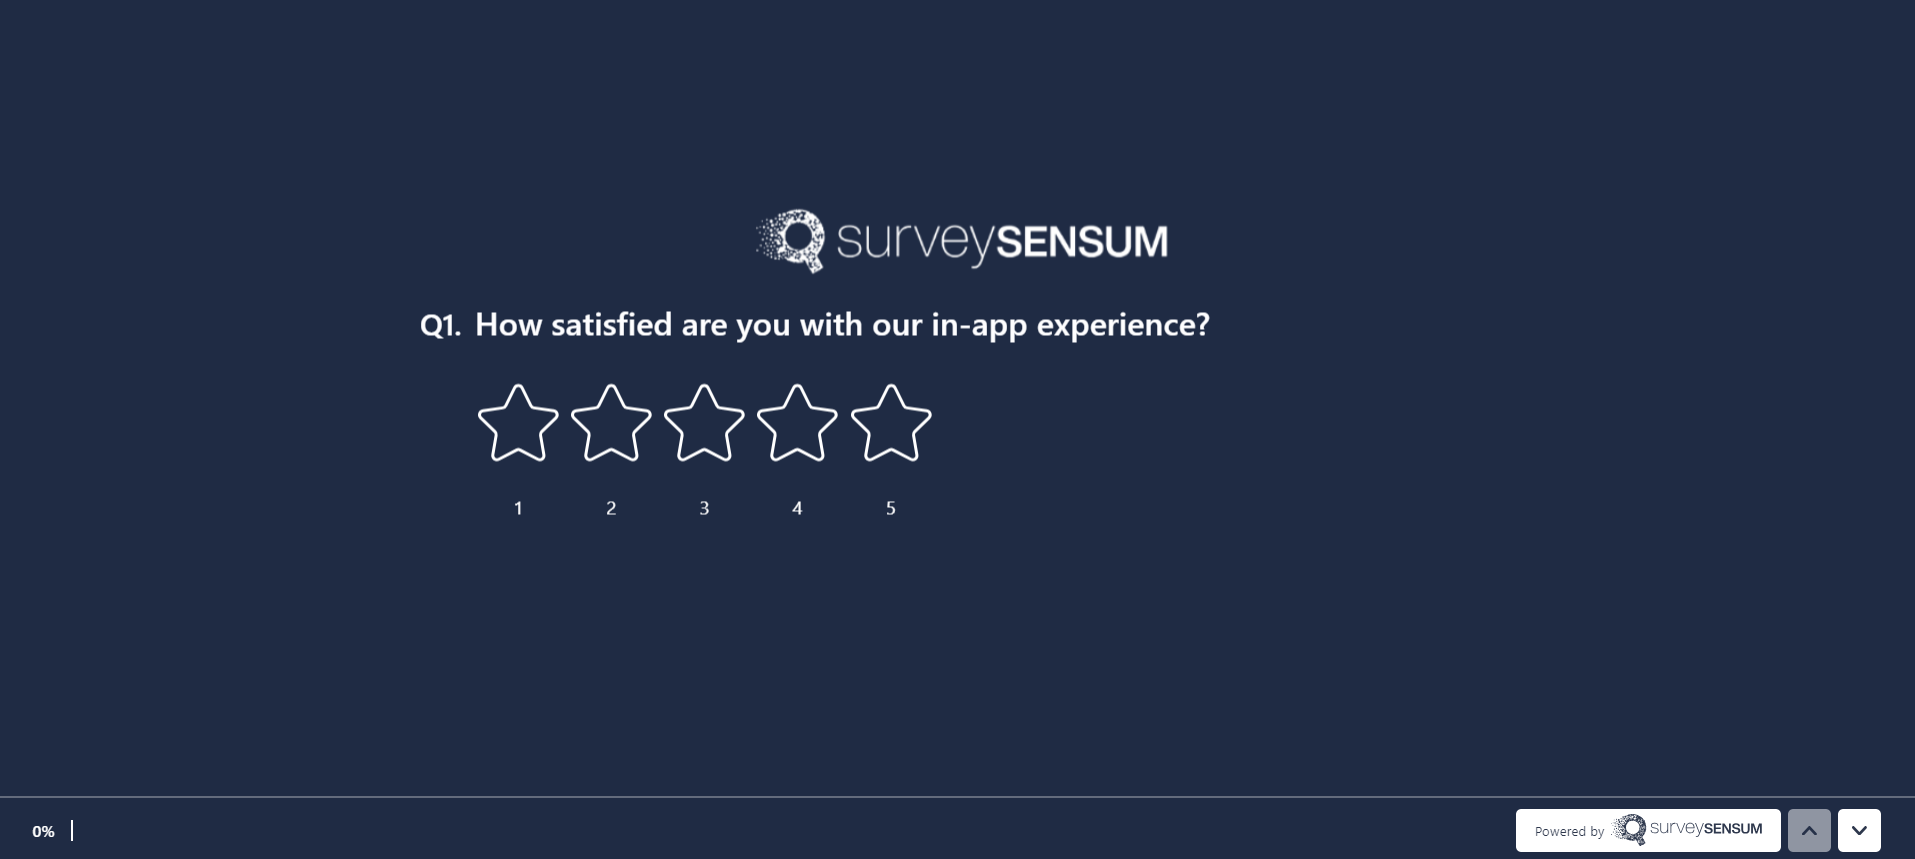
They use a numeric scale (e.g., 1-5 or 0-10) to measure intensity of satisfaction, likelihood, ease, etc. You can use them to track standard CX metrics such as NPS, CSAT, and CES.
Example: “On a scale of 0-10, how likely are you to recommend our service to a friend?”
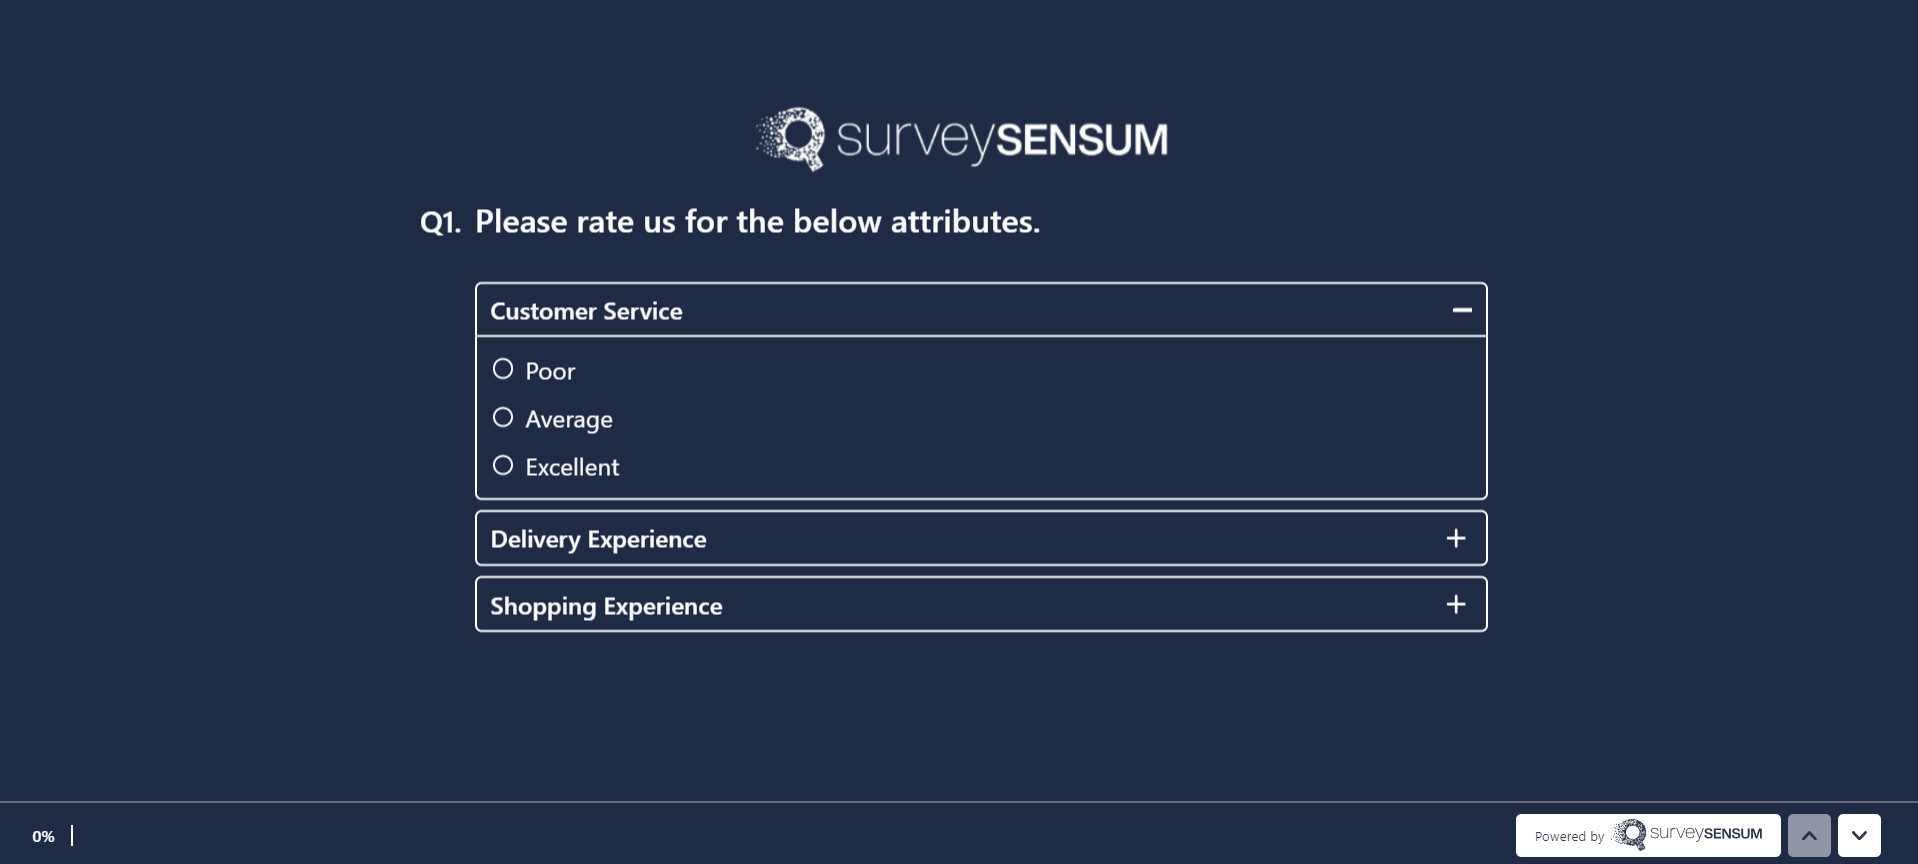
2. Multiple Choice Questions (MCQs)
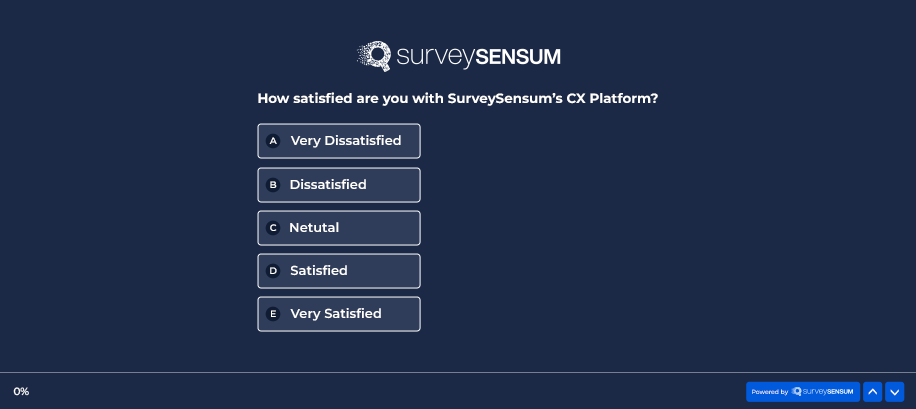
Here, respondents are required to choose an option from a set of predefined answers.
Example: “What was the main reason for contacting support today?”
- Order delay
- Product defect
- Account issue
- Other
3. Binary Questions
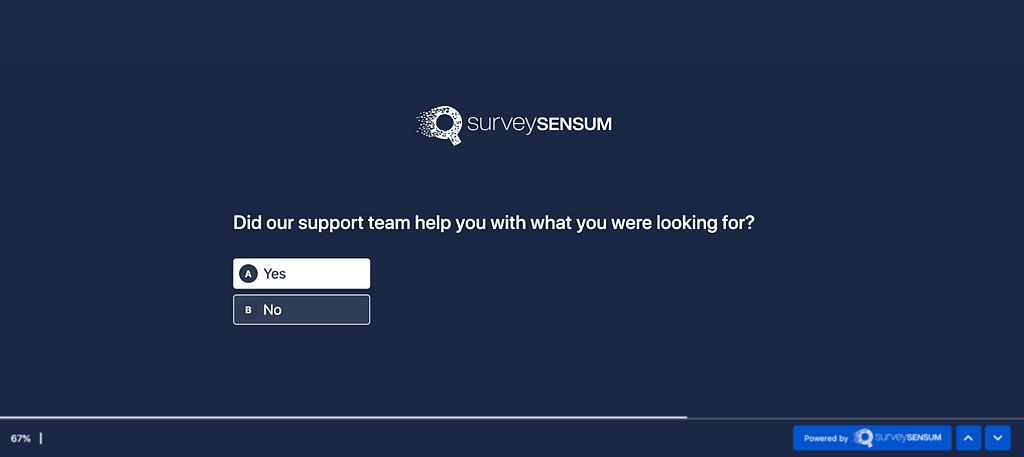
These questions provide two distinct options to choose from, usually “Yes” or “No.”
Example: “Was your issue resolved during this chat?” (Yes/No)
4. Open-Ended Questions
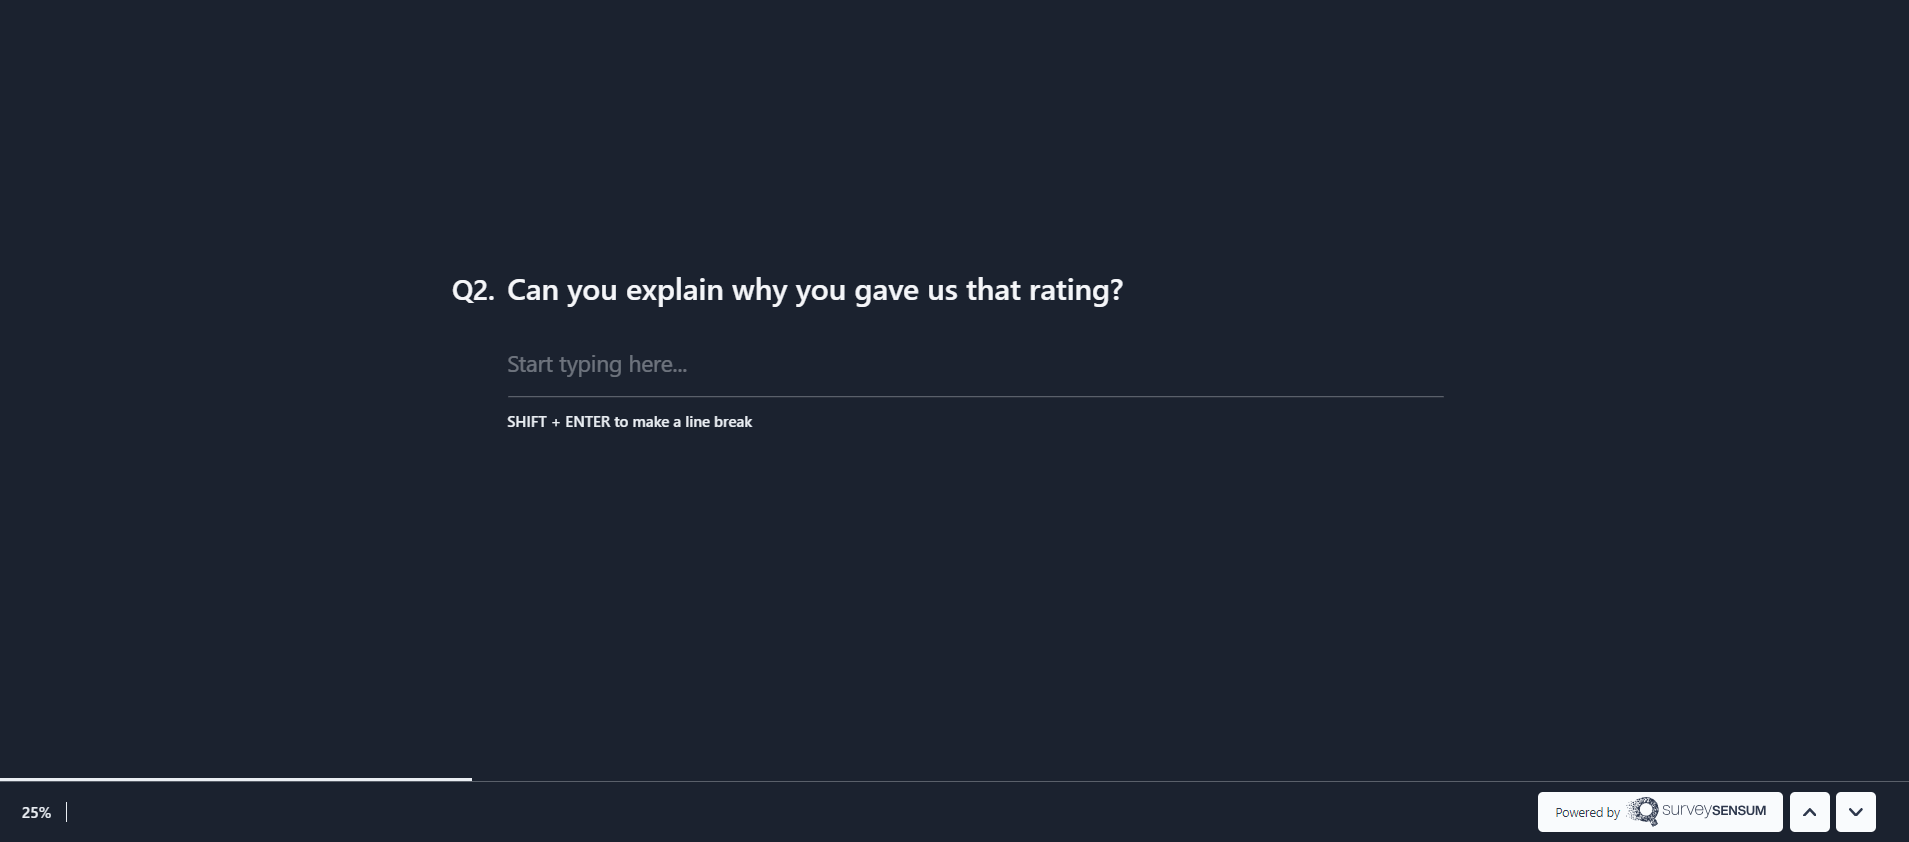
Open-ended survey questions allow customers to answer in their own words rather than rating, ranking, or choosing from given options.
Example: “What could we have done better during your onboarding experience?”
5. Dropdowns Questions
The respondent selects one option from a list that appears when they click a dropdown arrow.
Example: “Please select your country.”
6. Ranking Questions
In this type, the respondent arranges a list of items in order of preference or importance.
Example: “Please rank the following features based on usefulness.”
- Drag-and-drop Editor
- Mobile App
- Custom Workflows
- AI Chatbot
7. Likert Scale Questions
The respondent indicates their level of agreement or disagreement with a given statement.
Example: “Do you agree with this statement: I found the setup process to be easy.”
- Strongly Disagree
- Disagree
- Neutral
- Agree
- Strongly Agree
8. Semantic Differential Questions
Similar to the Likert scale, a semantic differential question requires the respondent to rate a concept or item on a scale between two opposite adjectives.
Example: “How friendly was our customer service representative?”
- Very Unfriendly
- Unfriendly
- Neither Friendly Nor Unfriendly
- Friendly
- Very Friendly
Step 5: Design Your Survey Thoughtfully
Even the best questions can fall flat if your survey feels clunky, off-brand, or overwhelming. So, before you hit send, go through the following survey design strategies:
- Organize your questions in the proper sequence. Begin with the most important one and then move to follow-up questions. For example, in a Net Promoter Score (NPS) survey, the first question will be the rating scale. If needed, you can add an open-ended question to gather more context.
- Use survey logic. This helps you automatically show or hide questions based on how a respondent answers. For example, if someone gives a low NPS score, the survey directs to a follow-up asking what disappointed them. If they give a high score, they are asked what stood out.
- Group related questions together. This is crucial as jumping between unrelated subjects can cause confusion and survey fatigue.
- Stick to one type of rating scale (e.g., all 1-5, or all 1-7). Mixing scales can make it difficult for respondents to interpret what each number means.
- Show a progress bar if you’re asking more than a few questions. People are more likely to complete it when they know how long it’ll take.
- Don’t forget edge cases. Think about what happens if someone skips a question or what the “thank you” screen says. These small things truly affect how a customer feels about your survey.
- Use your brand’s logo, colors, and fonts. This makes your survey recognizable and trustworthy.
- Match your brand’s tone of voice. So, if your tone is relaxed and friendly, say things like “Quick question — how did we do today?” If your tone is more formal, phrase things accordingly.
- Maintain design consistency. That is, the survey should feel like a natural extension of your website, app, or email communications.
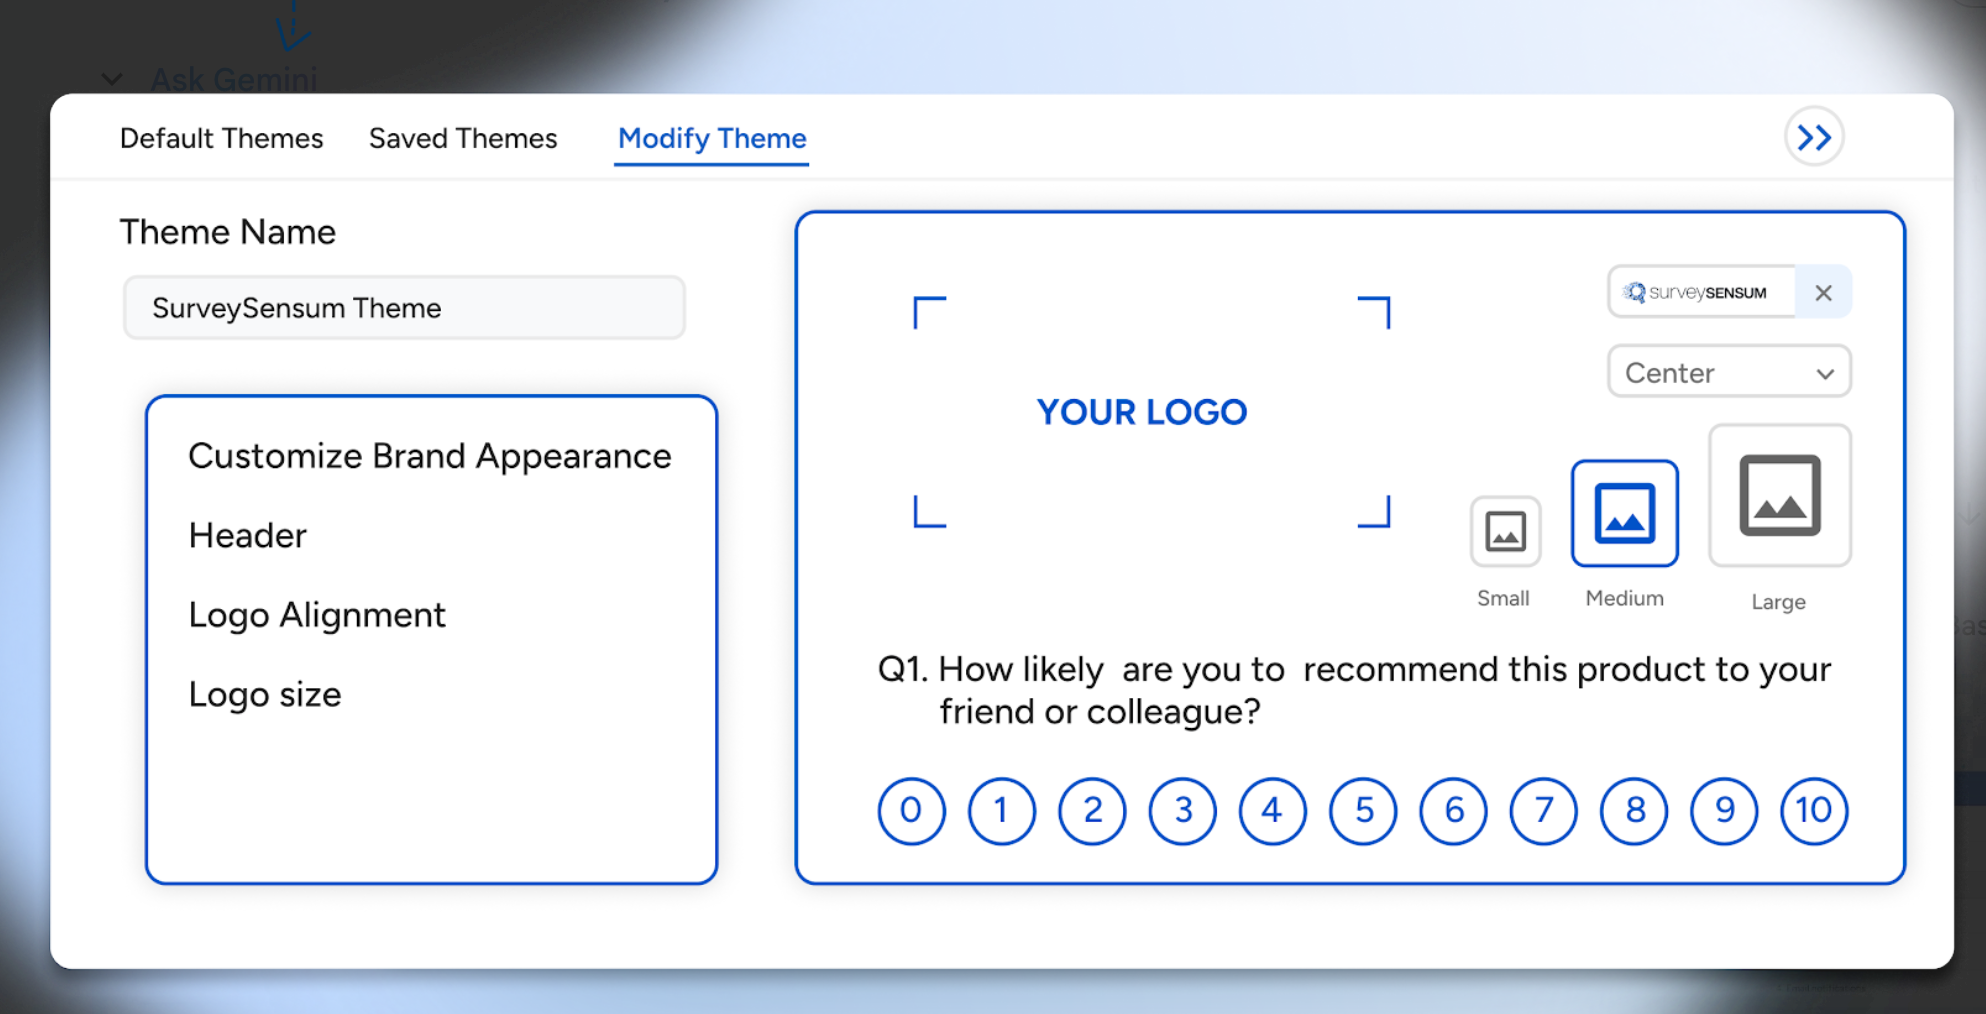
SurveySensum’s Survey Builder allows you to easily design multilingual customer feedback surveys (either from pre-built survey templates or from scratch). You can add any question type, set up smart logic to personalize the flow, upload your logo, apply brand colors and fonts, and fine-tune the layout. You can also create custom welcome and thank-you messages to create a survey experience that feels personal and completely on-brand.
Take full control over the look and feel of your CX survey. Try SurveySensum’s survey builder to create fully branded, customer-friendly surveys in minutes!
Free Forever • No Feature Limitation • No Credit Card Required • Sign Up For Free ![]()
This wraps up the process of designing a CX survey. Now, let’s take a look at what comes next.
What to Do After the Survey Is Designed?
It’s time to send out your survey, gather valuable insights, and make real improvements. Let’s quickly break this down:
1. Review Your Survey
Read through each question carefully to check for errors, incorrect logic, and bias. Avoid leading questions. For example, “How amazing was your experience today?” might feel friendly, but it also nudges users into a positive response.
2. Test It
Always test your survey across all devices — desktop, tablet, and especially mobile. Most users will complete surveys on their phone, so if anything breaks the layout or loads slowly, it’ll hurt your survey response rate.
3. Choose the Right Distribution Channels
Instead of sticking to just one channel to send your survey, like only email, try using different options. This means choosing 2-3 channels your customers actively use — whether it’s your app, your website, a quick text message, etc.
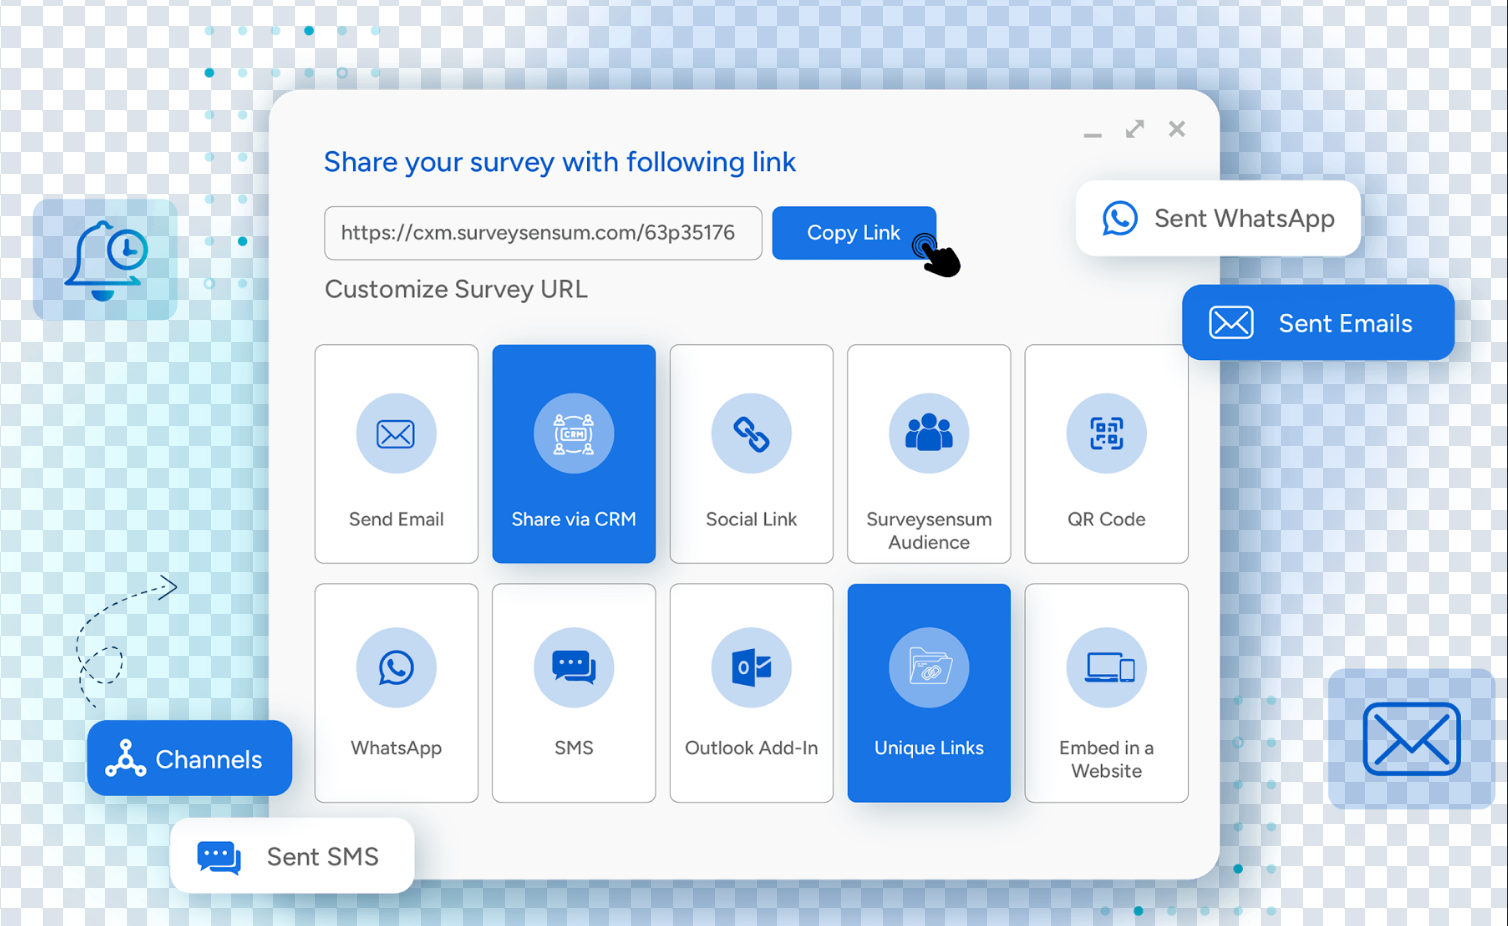
SurveySensum’s Survey Distribution tool makes it easy to reach customers wherever they are. You can share your CX surveys via email, add them to your website or app, or send them on WhatsApp/SMS. What’s more, you can also generate and share QR codes to give your customers instant access to surveys!
Want to distribute CX surveys across multiple channels in an instant? Use SurveySensum to automate multichannel survey distribution today.
Free Forever • No Feature Limitation • No Credit Card Required • Sign Up For Free ![]()
4. Send It at the Right Time
The “right” time depends on the touchpoint you’re measuring. For example, a customer satisfaction survey should be sent right after an interaction, while an NPS survey yields better results 30-60 days after onboarding.
To boost response rate, send surveys when your audience is most active on that channel. Consider scheduling the survey to align with the respondent’s local comfortable hours if you have a global audience.
5. Analyze Feedback
Once your survey is live and responses start rolling in, the real work begins — making sense of what your customers are trying to tell you.
CX data analysis can be broken down into two steps:
Analyzing Quantitative Data
Think of quantitative data as feedback you can count, like ratings, rankings, etc. Not every survey might collect this, but for those that do — like NPS, CSAT, and CES — you must first calculate these scores.
For example, if you send an NPS survey, you’ll tally up those 0-10 scores to get your final NPS number. The same goes for other customer experience metrics.
Manually calculating NPS scores can eat up time and lead to errors, especially at scale. SurveySensum’s NPS software eliminates this hassle with its built-in calculator that allows you to measure your NPS in real time as responses come in. You can also identify trends over time to see exactly when your score improves or dips.
Analyzing Qualitative Data
Next, analyze answers to the open-ended questions like “Why did you give us that score?” or “What can we do better?”
These free-text answers are incredibly valuable because they give you the “why” behind the customer experience metric.
Here’s how to analyze qualitative data:
-
Tag Your Responses
Think of tags as labels that sum up the main point or the theme of the open-ended comment. For example, “I tried contacting support, but no one was available” can be tagged as “Poor customer service.”
These tags help you group similar feedback together, making it easier to see how often certain issues come up. As a result, you’re able to quantify free text and track changes in it over time.
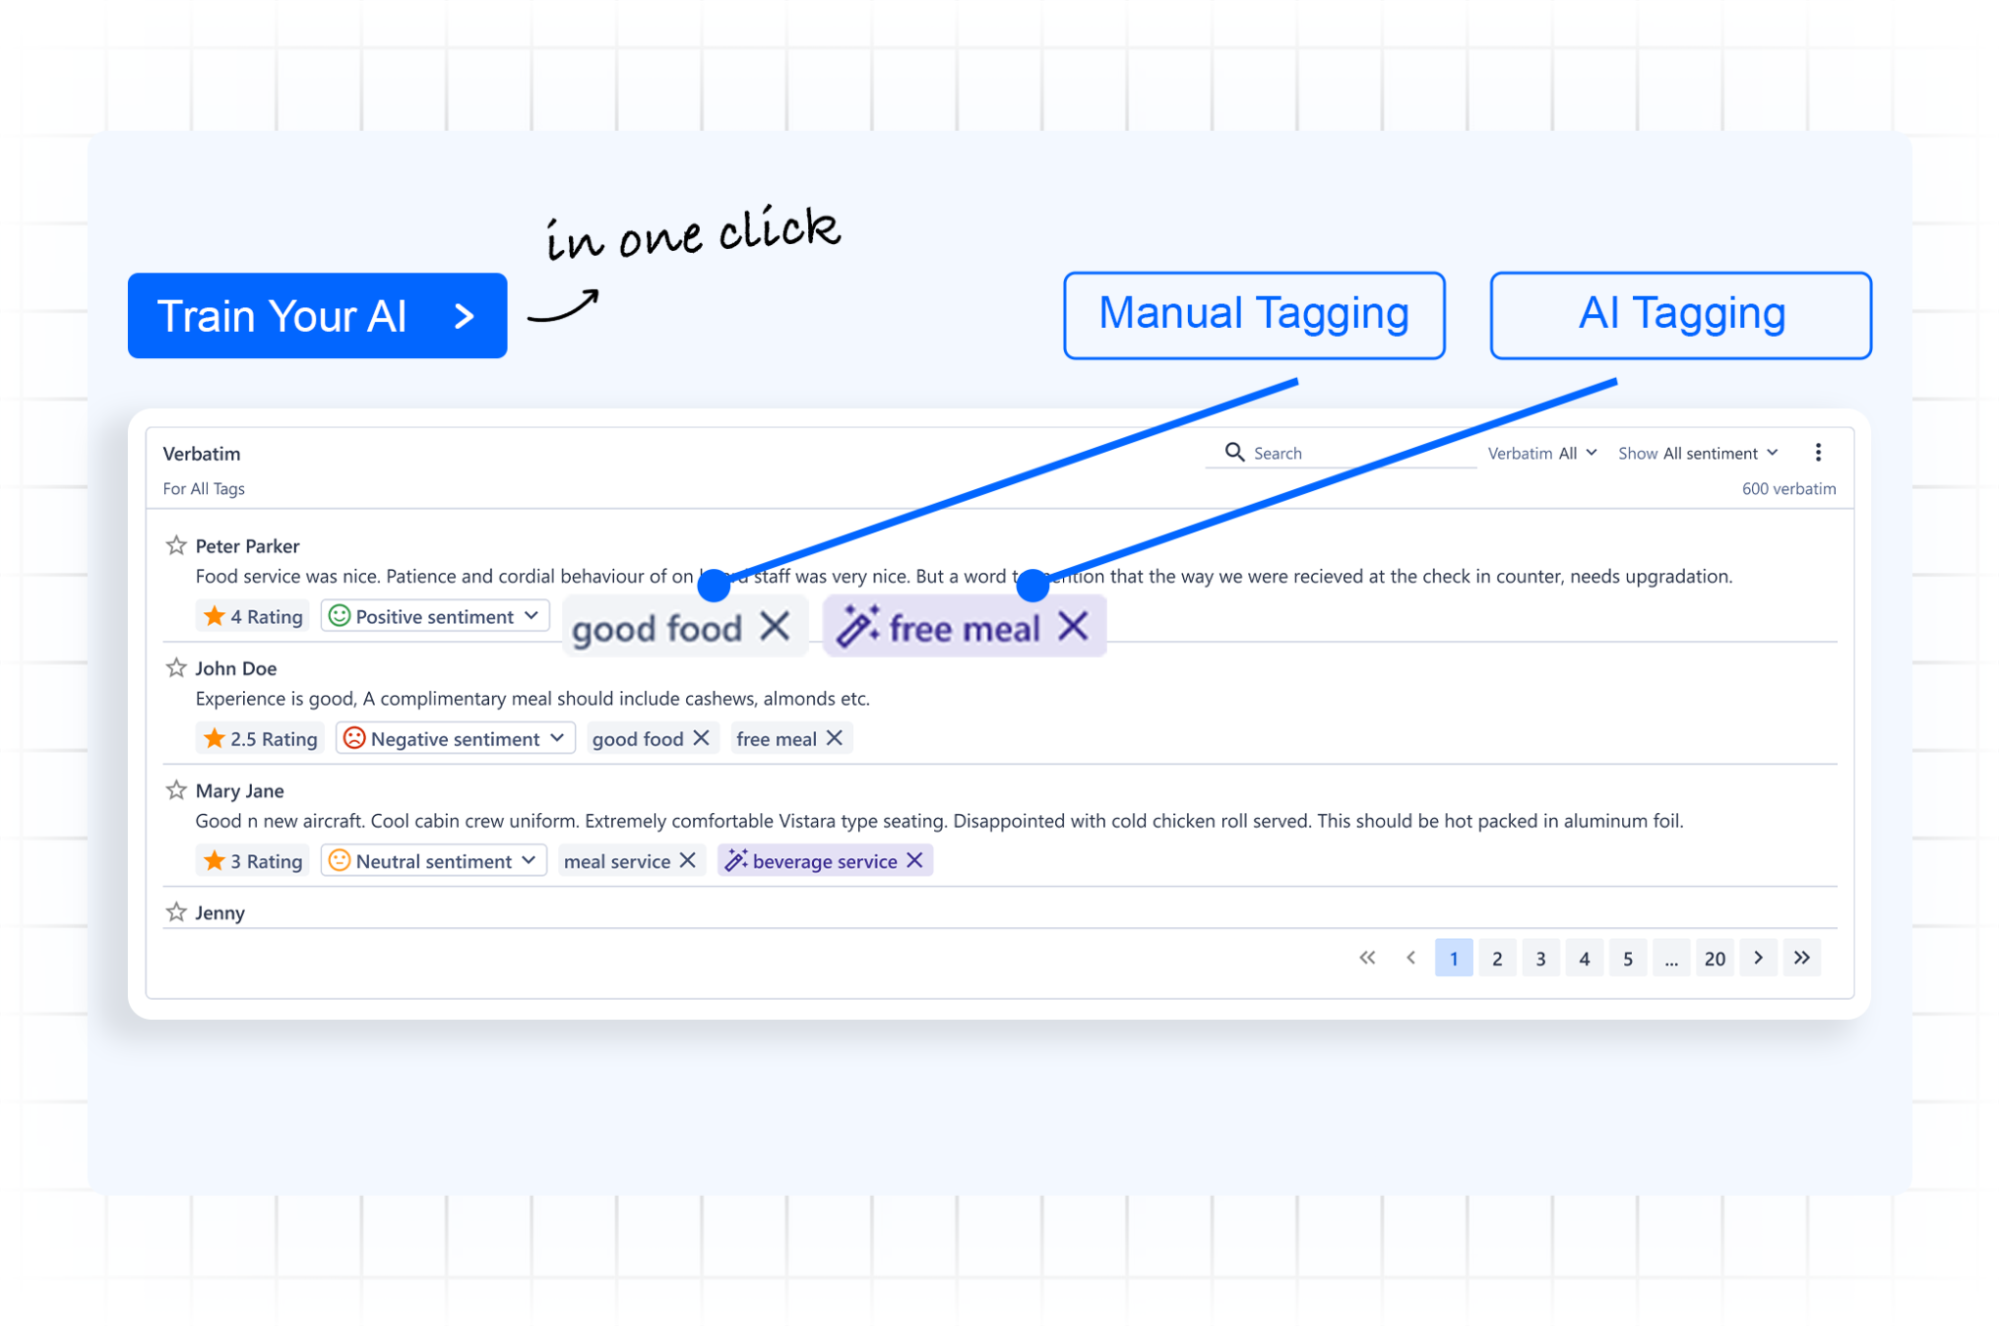
With SurveySensum’s AI-powered Text Analytics software, you don’t need to comb through every comment manually. The tool scans through large volumes of open-ended responses in minutes and automatically tags them with relevant themes. You can also add custom tags, filter customer feedback by tag, and see how frequently each tag appears in the feedback.
-
Use Sentiment Analysis
Sentiment analysis helps you understand the emotion behind each comment, i.e., if a comment is mostly positive, neutral, or negative. This is necessary for finding issues that carry the most emotional weight for your customers.
However, manually reading and analyzing every response to gauge customer sentiment is a chore. This is where SurveySensum helps. It uses AI to automatically tag each survey response by the sentiment detected, offering you insights into how customer emotions develop and change over time.
-
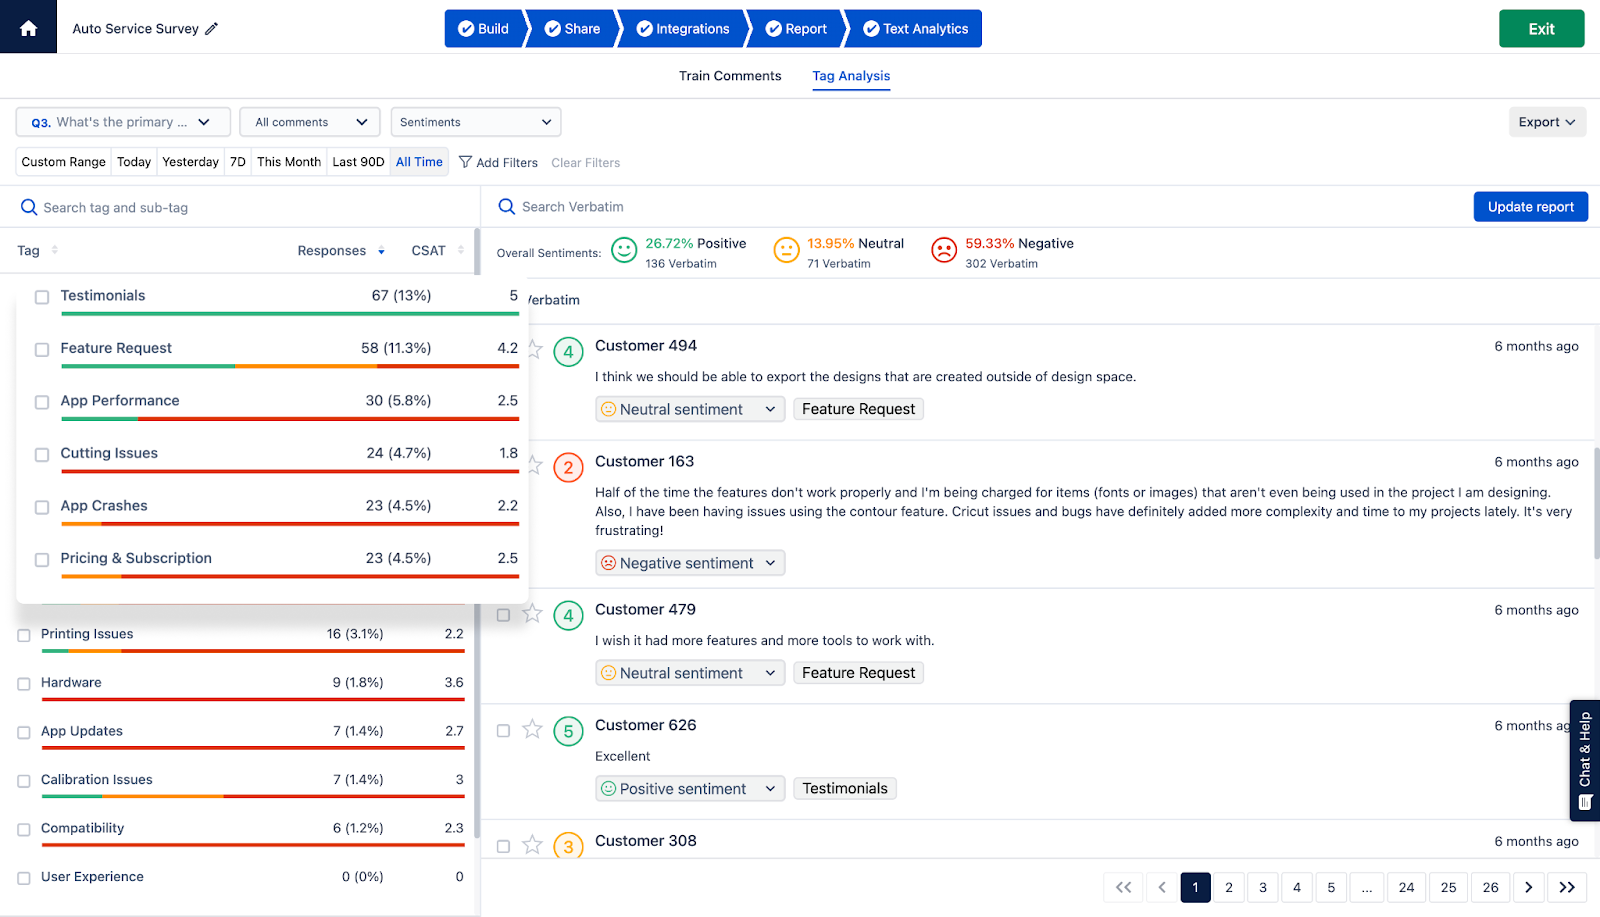
Identify Key Drivers
Key drivers are specific pain or praise points that heavily influence your CX metric. For example, in a customer satisfaction survey, if the majority of negative feedback is tagged with “Confusing UI,” then that is the key driver of poor customer satisfaction.
You can supercharge this process using SurveySensum’s key driver analysis, wherein you can instantly identify which issues or strengths have the biggest impact on scores like NPS or CSAT. The platform shows to what extent each driver influences the CX metric, thus providing you with clarity on what to prioritize.
6. Visualize the Insights
There are different ways to visualize your customer insights:
- Use bars or column charts to compare satisfaction scores across products, time periods, or customer segments.
- Use line graphs to track trends over time, like a drop in NPS after a feature release
- Use pie charts to show proportions. For example, how many customers cited different reasons for dissatisfaction.
- Use heatmaps to identify clusters or outliers in responses
- Use word clouds to highlight recurring phrases
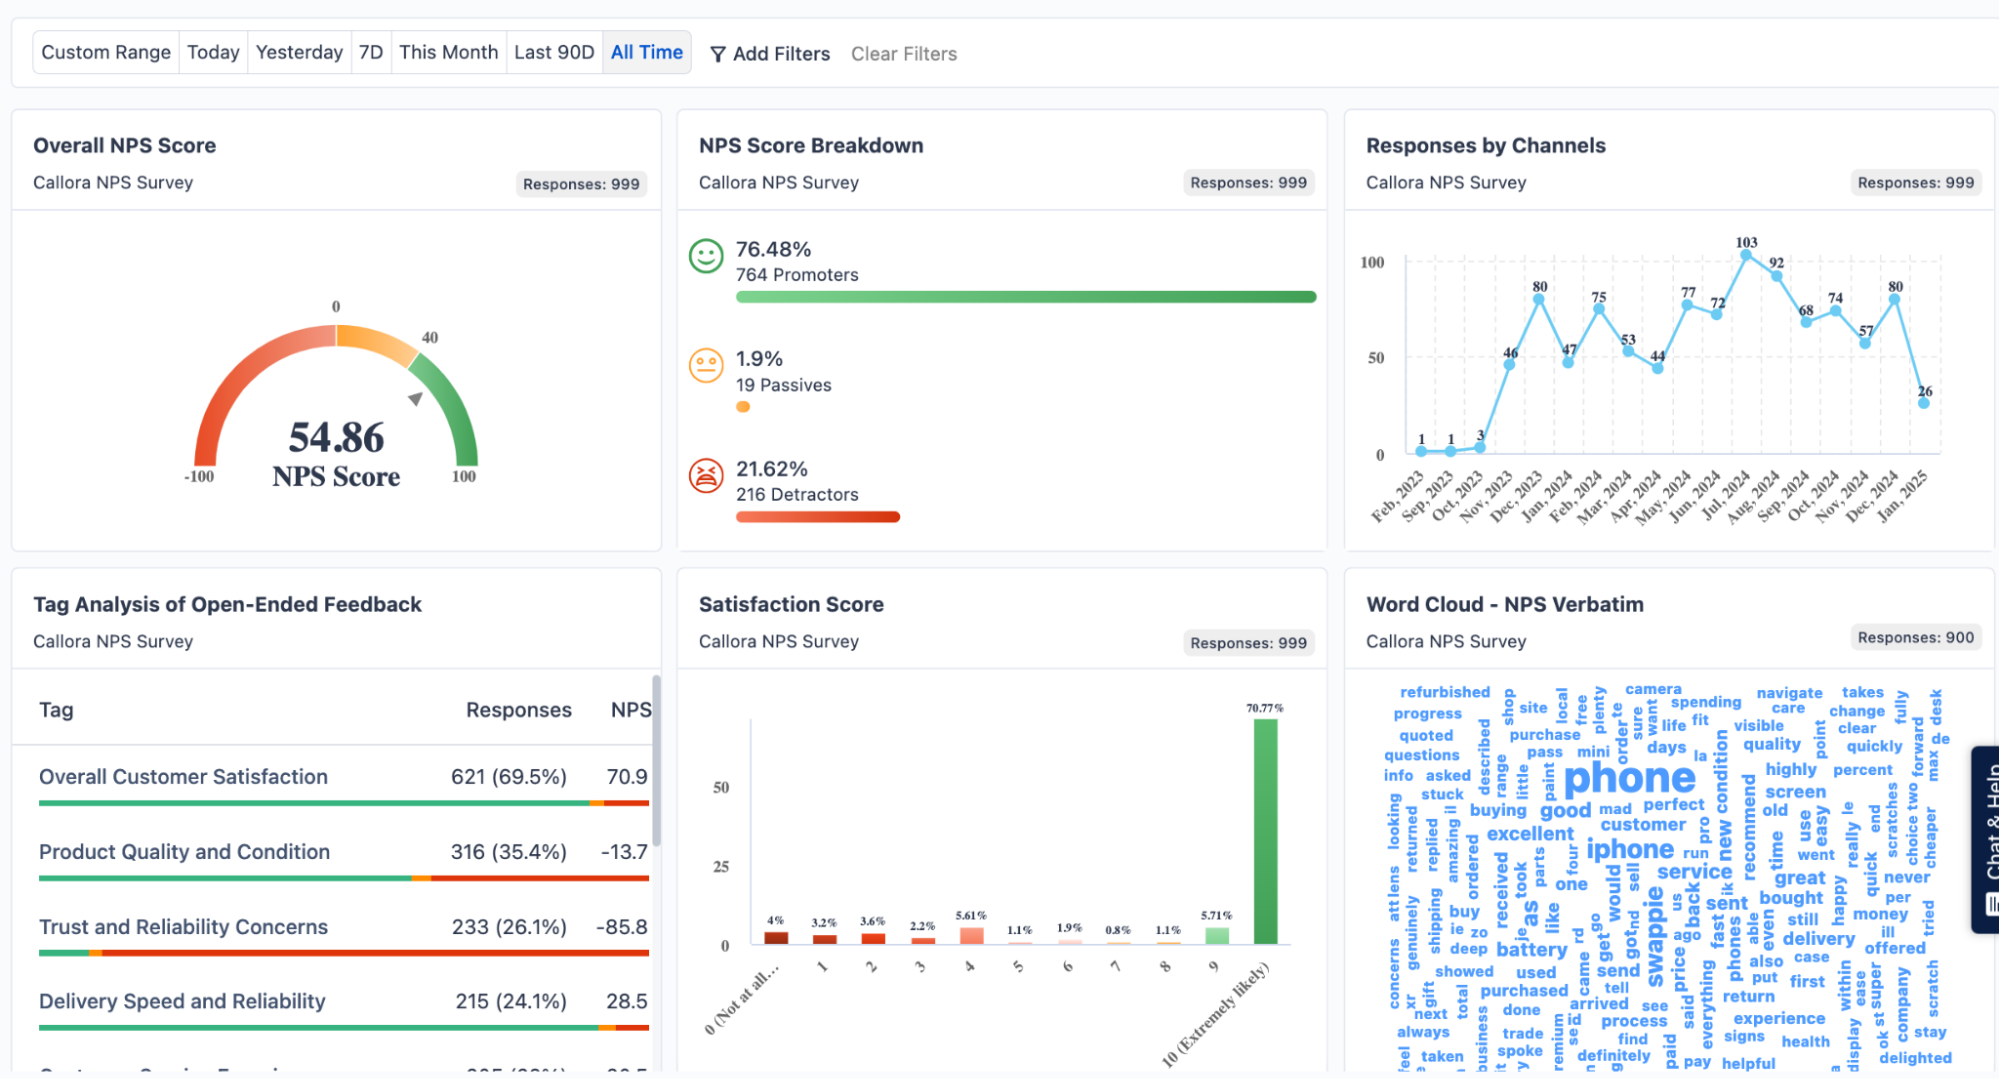
SurveySensum’s Dashboard not only makes it easy to interpret complex data but also helps you report on survey insights. It allows you to track CX metrics over any time period (weekly, monthly, quarterly) and visualize trends using intuitive widgets. You can filter data by customer segments, locations, products, touchpoints — the sky is the limit! Most importantly, you get to create custom dashboards to share specific insights with different team members!
Monitor every CX metric without digging through spreadsheets or PowerPoint! Create custom dashboards with SurveySensum and get insights that are always up to date.
Free Forever • No Feature Limitation • No Credit Card Required • Sign Up For Free ![]()
7. Act on the Feedback
Collecting and analyzing survey results is only half the job. If you don’t act on what your customers are telling you, the survey loses its value.
To learn how to take structured action based on your survey data, check out this detailed post-survey action plan guide.
Now, let’s take a look at some best practices to follow when creating a CX survey.
8. CX Survey Best Practices for Survey Response Optimization
Below are 8 best practices to survey customers and get high-quality customer feedback:
- Keep Your Survey Short: Don’t treat your survey like a form. Only ask what you’ll actually use and skip anything that is “nice to know.”
- Tailor Your Survey to Your Target Audience: Adjust tone, length, question type, and even channel based on who you’re targeting.
- Use Simple Language: Write like you talk. Use clear, everyday language that your customers will understand instantly.
- Don’t Ask Too Much in One Question: Each question should explore a single idea. For example, “How would you rate our product and customer service?” is problematic.
- Be Neutral: If your questions subtly push respondents toward a specific answer, the feedback is skewed. So, avoid emotionally loaded words, double negatives, and assumption-based phrasing.
- Minimize Distractions: Keep your survey design clean and free from anything that might take attention away from the questions.
- Offer Incentives Relevant to Your Audience: A $10 gift card might work for B2C customers, but an exclusive industry report might be more valuable for B2B customers. This will encourage more people to take part.
- Craft Strong Invitations: Write clear and inviting subject lines or messages when you send out your survey.
Below, we’ve shared some examples of commonly used survey questions that you can include in your customer experience survey.
Examples of Customer Experience Survey Questions
- On a scale of 1 to 5, how would you rate your overall satisfaction with [Product/Service]?
- To what extent do you agree with the following statement: “The support agent quickly resolved my issue?”
- What was the primary reason for the score you gave above?
- Did you enjoy the delivery experience for [Product]? (Yes/No)
- Which of these features do you use most frequently? (Feature 1, Feature 2, Feature 3, Feature 4)
- How likely are you to recommend our brand to a friend or colleague?
- How satisfied were you with the ease and clarity of our onboarding process?
- Which of the following words best describes how you feel when using our product? (Delighted, Frustrated, Confused, Efficient)
- On a scale of 1 to 5, how well do you feel [Company Name] delivers on its promise of making complex tasks simple?
- What’s one thing we could have done better?
Conclusion
How you build and analyze a CX survey is as important as creating it in the first place. In fact, the quality of your CX survey directly impacts the quality of the feedback gained from it.
If you’re asking irrelevant questions, the survey is hard to use, or you don’t dig deep into the results, you’ll miss out on insights that could genuinely improve your customer experience.
That’s why 500+ companies trust SurveySensum for their CX surveys. Our platform lets you easily design, brand, and send out surveys, all in one place. Plus, it offers a powerful AI engine for CX data analysis, visualization, and reporting.
Tired of switching tools just to run one simple survey? With SurveySensum, you can build, send, and analyze CX surveys in a single platform!
Free Forever • No Feature Limitation • No Credit Card Required • Sign Up For Free ![]()
FAQs on CX Surveys
1. How often should I conduct CX surveys?
That depends on what you’re trying to measure. If it’s a post-interaction experience (like after a support call or purchase), you can send CX surveys right after the event. But if you’re measuring overall customer satisfaction or loyalty (like NPS), doing it every quarter or twice a year is usually enough.
2. How do I choose the right CX metric for my survey?
It comes down to your goal. If you want to know how many loyal customers you have, go with NPS. If you’re trying to gauge how satisfied someone was after a specific event, CSAT is the answer. To learn more, refer to the table in this section.
3. How can I get more people to respond to my survey?
The key to getting more responses lies in designing a survey that’s short, simple, and relevant to the target audience. Choose the best time and distribution channel to increase the likelihood of the customer filling out the survey. Personalize the invite if possible, highlighting how their feedback will help. Incentives help, too, but clarity and timing matter most.
Launch Your NPS Program With SurveySensum That Will Actually Work!
Free Forever • No Feature Limitation • No Credit Card Required • Sign Up For Free ![]()

Increase ROI by 3x with targeted feedback & analysis
Boost Customer Satisfaction by up to 20%
Reduce Churn by identifying pain points in real time
See it in Action
Contents
How much did you enjoy this article?