
Picture this: You go to a small boutique where the owner greets you by your name, remembers your preferences, and makes your shopping an experience rather than a transaction. Now, picture a high-end boutique with a luxurious interior but you get a bone-dry experience, not a personalized one, and employees don’t even remember your recent interactions.
Which one would you go back to?
I’d say that more than half of the readers would choose the first boutique as it welcomes you and gives you a personalized customer experience.
Am I right or am I right?
Well, customers now have endless options at their fingertips which means it’s not just about shopping anymore, it’s all about the OVERALL EXPERIENCE.
And guess what – on average, companies that put in the work to improve the customer experience see a 42% improvement in customer retention, and a 33% improvement in customer satisfaction.
Now, in order to give that positive and personalized experience to your customers you need to make sure that your customers are engaged with your brand. And to do that you need to track your customer engagement metrics, using a robust customer feedback tool.
Why?
– Because these metrics serve as the compass guiding your business toward understanding, measuring, and enhancing interactions with your customers.
So, what are these customer engagement indicators that you need to measure in 2024?
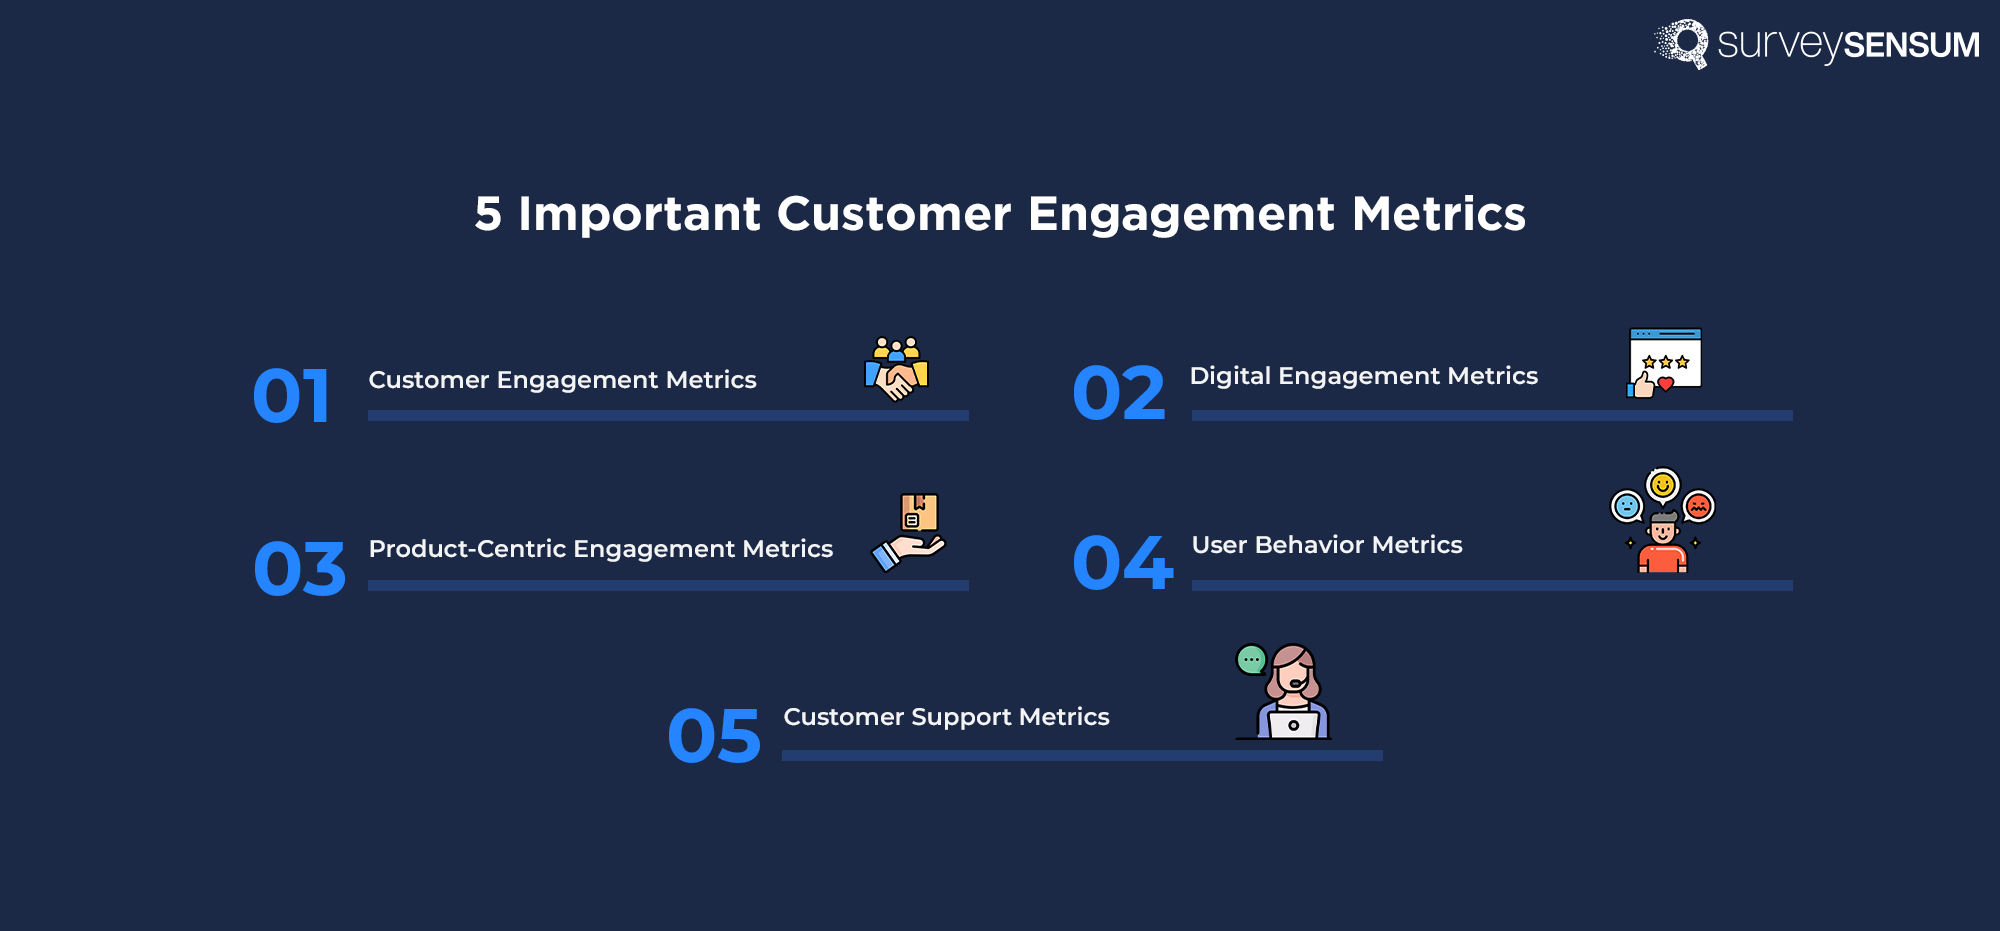
5 Customer Engagement Metrics to Watch Out for in 2024
1. Overall Customer Engagement Metrics
1. Customer Satisfaction Score
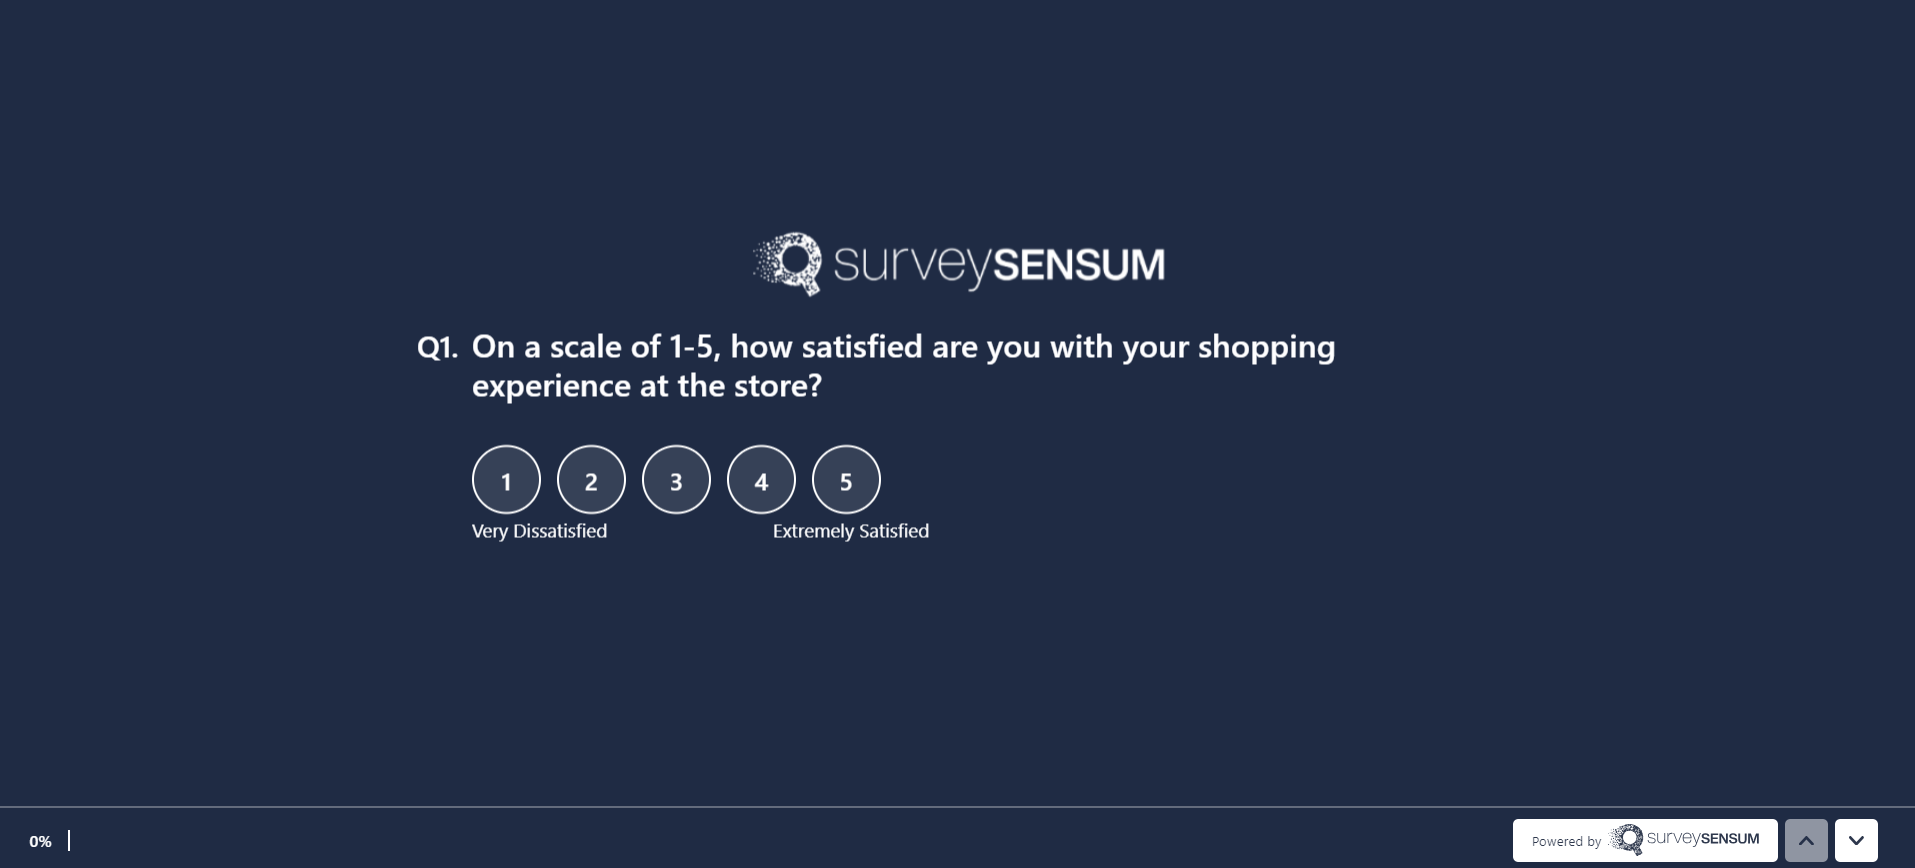
- Definition: A metric that measures how satisfied customers are with a product or service.
→ For example, “On a scale of 1-10, how satisfied are you with our product/service?”
- Why is it important: CSAT reflects immediate customer satisfaction and can help identify areas for improvement. A high CSAT score generally indicates satisfied customers, but it’s crucial to delve into the qualitative feedback to understand the why behind the satisfaction or dissatisfaction.
- Calculation: To calculate the CSAT score, divide the total number of positive responses by the total number of responses. Multiply the average score by 100 to convert it into a percentage.
CSAT score % = (Number of positive responses / Number of total responses) x 100
→ For example, if 100 customers filled out the survey and only 80 customers clicked on the happy face then your total CSAT score would be:
80/100 x 100= 80%
Your CSAT score is 80%
2. Net Promoter Score
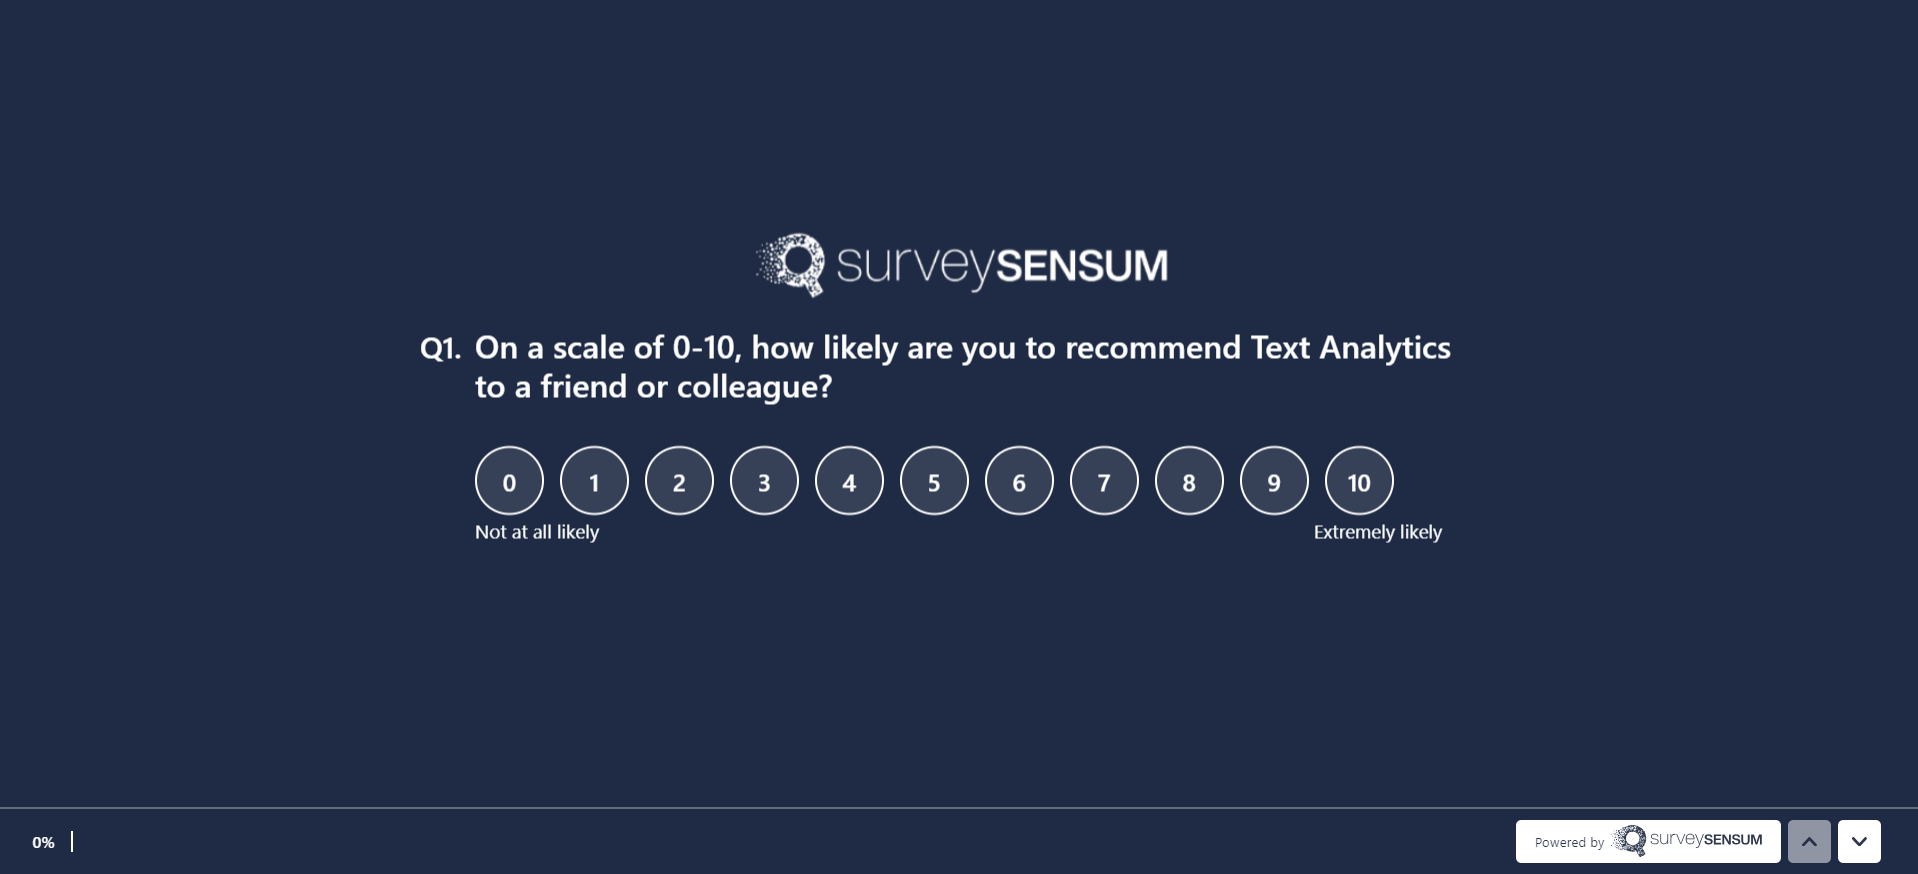
- Definition: NPS indicates the likelihood of customers recommending a product or service to others.
→ For example, “On a scale of 0-10, how likely are you to recommend Text Analytics to a friend or colleague?”
- Importance: NPS provides a holistic view of customer loyalty and brand advocacy. It classifies customers into promoters, passives, and detractors. The score is not just a number – it represents a collective sentiment that can be a powerful predictor of a company’s growth potential.
- Calculation: To calculate the NPS, calculate the percentage of promoters, passives, and detractors, and then subtract the percentage of detractors from the percentage of promoters to get the NPS.
NPS = % Promoters – % Detractors
→ For example, if 40% of respondents are Promoters and 20% are Detractors, the NPS would be
40% − 20% = 20
So, your NPS score is 20.
3. Customer Effort Score
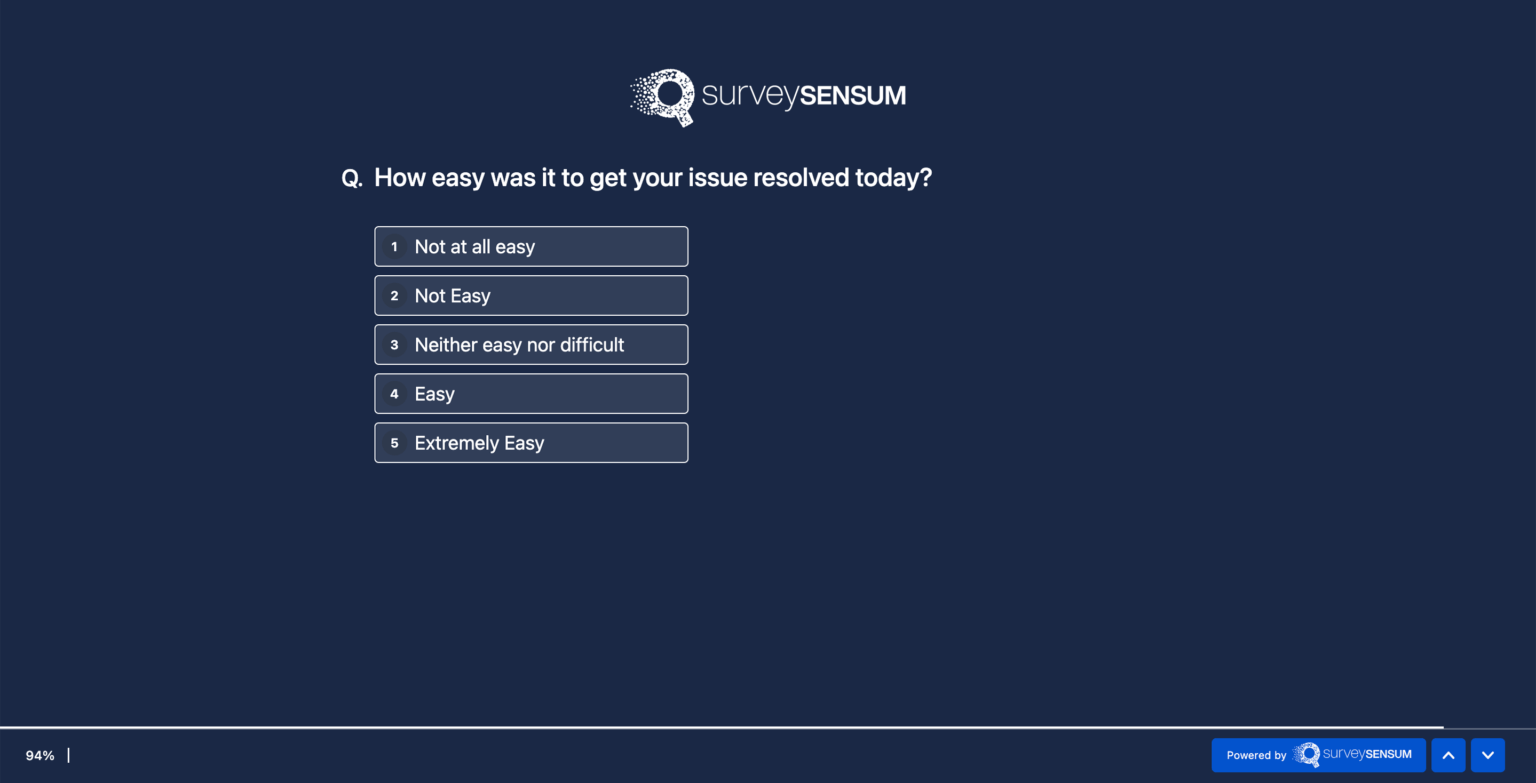
- Definition: This customer engagement metric gauges the effort put in by the customer to get an issue resolved or perform a task.
→ For example, “How easy was it for you to create an account on our website?”
- Importance: CES goes beyond measuring satisfaction by focusing on the easiness of the customer journey. A low-effort experience often correlates with higher customer loyalty. By reducing customer effort, businesses aim to create frictionless experiences, fostering long-term relationships.
- Calculation: To calculate the CES score, sum all the numeric scores from the responses received and divide the total score by the number of responses to calculate the average score.
CES = Sum of all individual scores/Number of customers who provided a response
- → For example, if you had 100 responses with a total score of 400, the CES would be:
- CES = 400/100 = 4.
4. Customer Lifetime Value
-
- Definition: This customer engagement indicator measures the predicted net profit a company expects to earn from a customer throughout their entire relationship.
- Importance: CLV assesses the long-term value of a customer, guiding strategic decisions. By understanding the long-term value of a customer, businesses can tailor their efforts to attract and retain high-value customers, allocating resources effectively.
- Calculation: To calculate CLV,
-
- Define the time period for which you want to calculate CLV.
- Sum the total revenue generated and divide it by the number of purchases.
- Count the total number of purchases and divide it by the number of unique customers.
- Estimate the average number of years a customer is expected to stay engaged with your business.
- Calculate the rate at which customers churn with your business.
CLV = Avg. order value * Purchase frequency rate * Avg. customer value
So, start launching relevant customer experience surveys and gather real-time feedback!
Free Forever • No Feature Limitation • No Credit Card Required • Sign Up For Free ![]()
2. Digital Engagement Metrics
Digital engagement metrics are used to assess how users interact with digital content, platforms, or services. These metrics provide insights into user behavior, satisfaction, and the overall effectiveness of digital initiatives.
1. Website Traffic and Pageviews
- Definition: This customer engagement KPI checks website traffic, the total pages viewed, bounce rate, and conversion rate.
- Importance: This metric provides a quantitative measure of a brand’s online presence and popularity. The bounce rate indicates the percentage of visitors who navigate away from the site after viewing only one page, offering insights into user engagement. Meanwhile, the conversion rate measures the percentage of visitors who take a desired action, such as making a purchase or filling out a form.
Calculation: Bounce rate calculation involves taking the number of sessions where users bounced (visited only one page) divided by the total number of sessions and then multiplying the result by 100 to express it as a percentage.
Bounce Rate = (Total single-page sessions / Total sessions) * 100
2. Social Media Engagement
- Definition: This KPI for customer engagement measures the level of interaction on social media platforms such as Facebook, Twitter, and Instagram.
- Importance: Likes, shares, and comments serve as indicators of brand visibility and online customer engagement. This metric is not just about numbers – it reflects the impact of a brand’s content in the digital community.
Calculation: Calculate the engagement rate by adding up the likes, comments, and shares, then dividing that sum by the total number of followers. Multiplying the result by 100 expresses the engagement rate as a percentage.
Engagement Rate = ((Likes + Comments + Shares) / Total Followers) * 100
3. Email Engagement
- Definition: This metric evaluates the effectiveness of email campaigns, measuring factors like open rates and click-through rates.
- Importance: Open rates indicate the success of grabbing the recipient’s attention, while CTR gauges the effectiveness of the email’s call-to-action. These metrics help refine communication strategies and tailor content to resonate with the audience.
Calculation: The open rate is calculated by dividing the total number of opens by the number of delivered emails and then multiplying the result by 100 to express it as a percentage. CTR calculation involves dividing the total number of clicks by the number of delivered emails and then multiplying the result by 100 to express it as a percentage.
Open Rate = (Total opens / Number of delivered emails) * 100
Click-Through Rate = (Total clicks / Number of delivered emails) * 100
3. Product-Centric Engagement Metrics
Product-centric engagement metrics are used to assess how users interact with a product or service. These metrics provide insights into user behavior, satisfaction, and the overall effectiveness of the product.
1. Product Usage Frequency
- Definition: This metric monitors how frequently customers engage with and utilize a product.
- Importance: The frequency of product usage is a direct indicator of its relevance and utility in the customer’s routine. It unveils insights into whether the product has seamlessly integrated into the customer’s life, reflecting satisfaction and continued value.
Calculation: Calculate the average frequency of usage by dividing the total number of usage instances by the total number of customers or active users.
Usage Frequency = (Total usage instances / Number of customers or active users)
2. Feature Adoption Rates
- Definition: This metric measures the speed at which customers embrace and integrate new features of a product.
- Importance: The adoption of new features signifies the product’s adaptability and its ability to meet evolving customer needs. High adoption rates indicate that the new features resonate with the user base, enhancing the overall product experience.
Calculation: Calculate the adoption rate by dividing the number of customers adopting the feature by the total number of customers and then multiplying the result by 100 to express it as a percentage.
Adoption Rate = (Number of customers adopting a new feature / Total number of customers) * 100
So, launch an employee experience survey with SurveySensum to understand your employee satisfaction
Free Forever • No Feature Limitation • No Credit Card Required • Get a Live Demo ![]()
4. User Behavior Metrics
User behavior metrics provide insights into how individuals interact with a product, service, or platform. Analyzing these metrics is crucial for understanding user engagement, preferences, and areas for improvement.
1. Time-on-Site/In-App
- Definition: This metric measures the average time customers spend on a website/app during a single session.
- Importance: The duration users spend on a platform is indicative of engagement and interest. Longer periods suggest that visitors find the content or features compelling, while shorter durations may signal a need for improvement in content or user experience.
- Calculation: Calculate the average amount of time each user spends on the site or in the app by dividing the total time spent by the total number of users.
Average Time-on-Site/In-App = (Total time spent by all users / Number of users)
2. Conversion Rates
- Definition: Conversion rates quantify the percentage of visitors who complete a desired action, such as making a purchase, filling out a form, or subscribing.
- Importance: This metric is a crucial indicator of the effectiveness of marketing efforts and the overall user experience. A high conversion rate suggests that the website or app is successfully guiding visitors toward intended actions.
Calculation: Calculate the conversion rate by dividing the number of conversions by the total number of visitors and then multiplying the result by 100 to express it as a percentage.
Conversion Rate = (Number of conversions / Total number of visitors) * 100)
3. Churn Rate and Retention
- Definition: Customer churn rate measures the percentage of customers who discontinue services during a given period, while customer retention rate gauges the ability to keep existing customers over time.
- Importance: High customer retention and low churn rates signify a loyal customer base. Sustaining customer relationships is often more cost-effective than acquiring new customers, making these metrics essential for long-term business success.
Calculation: Calculate the churn rate by dividing the number of customers lost by the total number of customers at the start of the period and then multiplying the result by 100 to express it as a percentage. And by subtracting the churn rate from 100, you get the retention rate.
Churn Rate = (Number of customers lost during a period / Total customers at the start of the period) * 100
Retention Rate = 100 – Churn Rate
5. Customer Support Metrics
According to the Salesforce “State of the Connected Customer Report”, 88% of customers say good customer service makes them more likely to purchase again.
Customer support metrics are crucial for businesses to understand how well they are serving their customers and where improvements are needed.
1. First Response Time
- Definition: This metric measures the duration taken to respond to customer inquiries from the moment they are received.
- Importance: Swift responses are critical in enhancing customer satisfaction. Customers appreciate timely acknowledgment, even if the resolution might take longer. This metric is a key indicator of the responsiveness of a customer support team.
Calculation: Calculate the first response time by subtracting the time of the first response from the time of inquiry.
First Response Time = (Time of first response – Time of inquiry)
2. Resolution Time
- Definition: This metric tracks the duration taken to completely resolve a customer’s issue, from the time of inquiry to resolution.
- Importance: Efficient resolution contributes significantly to a positive customer experience. A shorter resolution time not only satisfies customers but also allows support teams to handle a larger volume of inquiries effectively.
- Calculation: Calculate the resolution time by subtracting the time of resolution from the time of inquiry.
Resolution Time = (Time of resolution – Time of inquiry)
3. Ticket Volume and Trends
- Definition: This metric monitors the volume of customer support tickets over time and identifies patterns or common issues.
- Importance: Understanding the volume of support tickets helps in resource allocation, ensuring that support teams are adequately staffed. Identifying trends and common pain points informs product improvements and preemptive customer communications.
- Calculation: Ticket volume is the number of tickets received within a specified period of time.
Ticket Volume = Number of support tickets received within a specified period
So, effectively navigating these customer engagement metrics will enable your business to optimize its operations, improve customer satisfaction, and proactively address emerging challenges.
Conclusion
From understanding customer satisfaction with the CSAT score to navigating the touchpoints of digital engagement and user behavior, businesses today need to gauge and enhance their customer relationships with the important customer engagement metrics discussed above.
The effective use of these metrics empowers businesses to adapt, innovate, and thrive in a customer-centric ecosystem. Now, to ensure effective use of these metrics, you need a robust customer experience management tool, like SurveySensum, to help you track and measure all the important metrics and KPIs with the help of powerful surveys.
Improve Your Customer Experience With SurveySensum!
Free Forever • No Feature Limitation • No Credit Card Required • Sign Up For Free ![]()

Increase ROI by 3x with targeted feedback & analysis
Boost Customer Satisfaction by up to 20%
Reduce Churn by identifying pain points in real time
See it in Action
How much did you enjoy this article?