Product NPS: Accurately Measure Customer Sentiment
Request a Demo
Ever wondered how major brands like Nike, Amazon, IKEA, etc always get it right when it comes to understanding customer sentiments and delivering exceptional experiences?
This is because they listen to the voices of their customers and constantly strive to deliver seamless experiences. But isn’t that a very cliche answer?
Well, it is but it’s not wrong!
Imagine pouring your hard work, creativity, and resources into crafting a product you believe in. And not knowing if your customers really like it!
Well, that’s where product NPS steps in.
Product NPS helps product managers identify areas for improvement and prioritize features that will have the most significant impact on customer satisfaction.
So, why not discover all its magical benefits and how to use product NPS effectively?
Let’s scroll down and start with product NPS’ meaning and its calculation.
What is Product NPS?
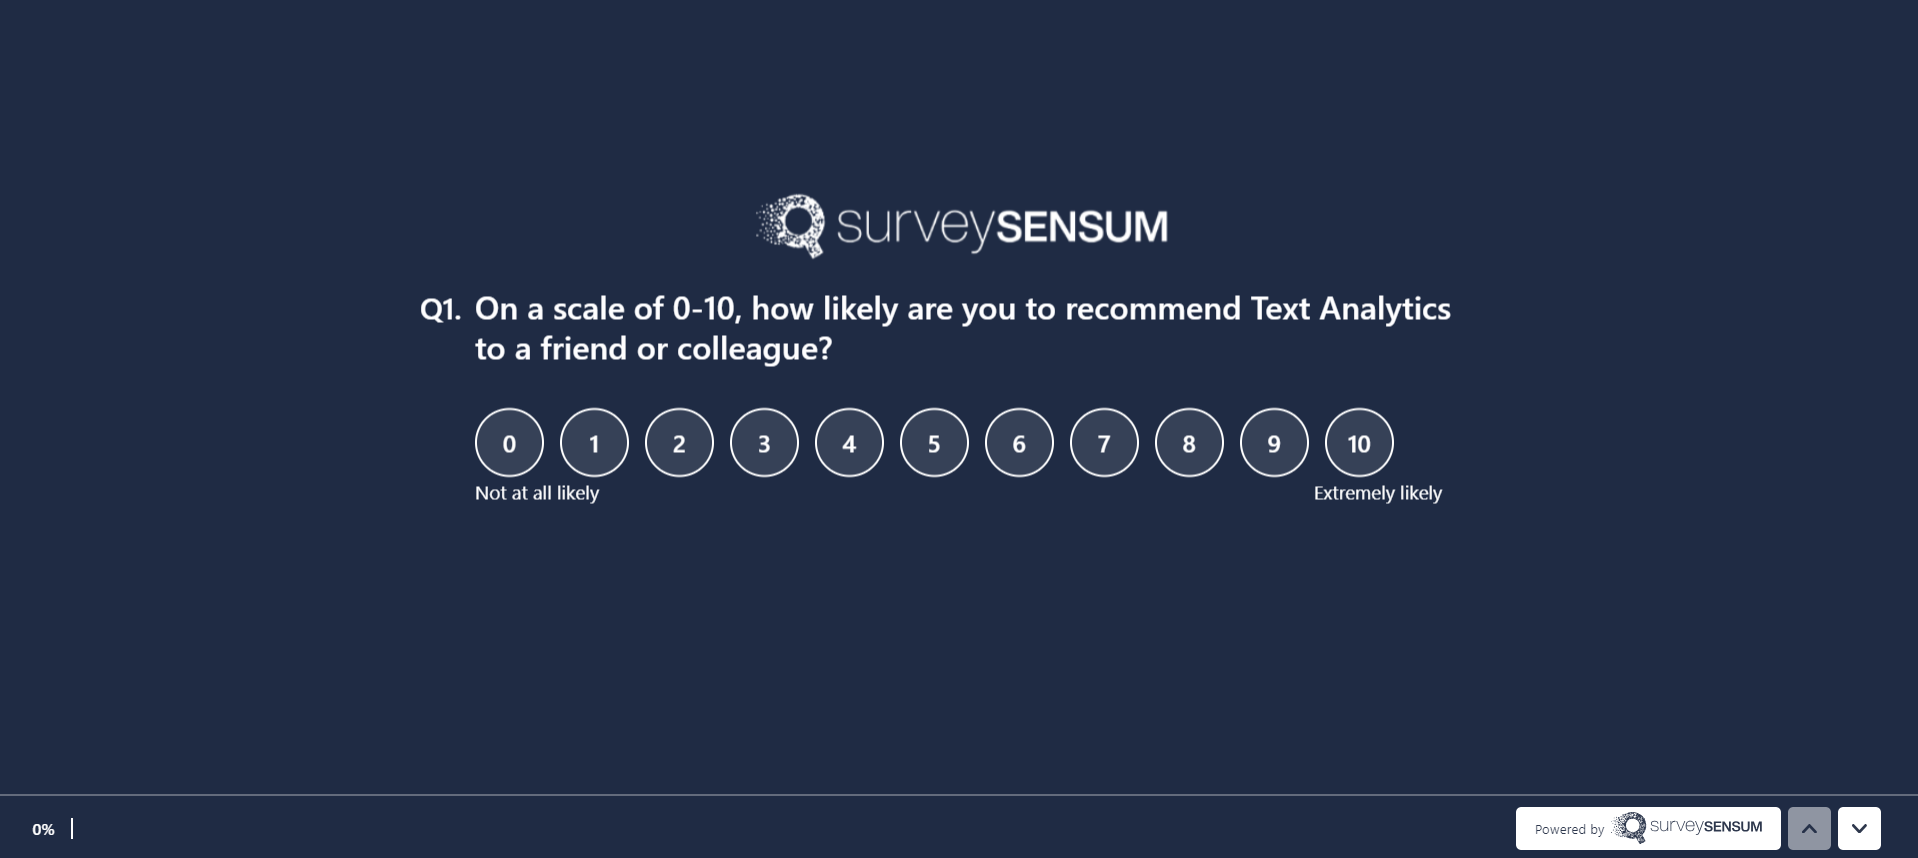
Product NPS is a customer satisfaction metric used by product managers to measure customer loyalty and satisfaction with a product. It is determined by asking customers a single question: “On a scale of 0 to 10, how likely are you to recommend this product to a friend or colleague?”
Based on their responses, customers are categorized into three groups:
- Promoters (score 9-10): These are customers who are highly satisfied with the product and are likely to recommend it to others.
- Passives (score 7-8): These customers are somewhat satisfied with the product but are not as enthusiastic as promoters. They are less likely to actively promote the product.
- Detractors (score 0-6): These customers are dissatisfied with the product and may even discourage others from using it.
→ Here’s how you can convert detractors into promoters in NPS.
NPS Calculation and Formula
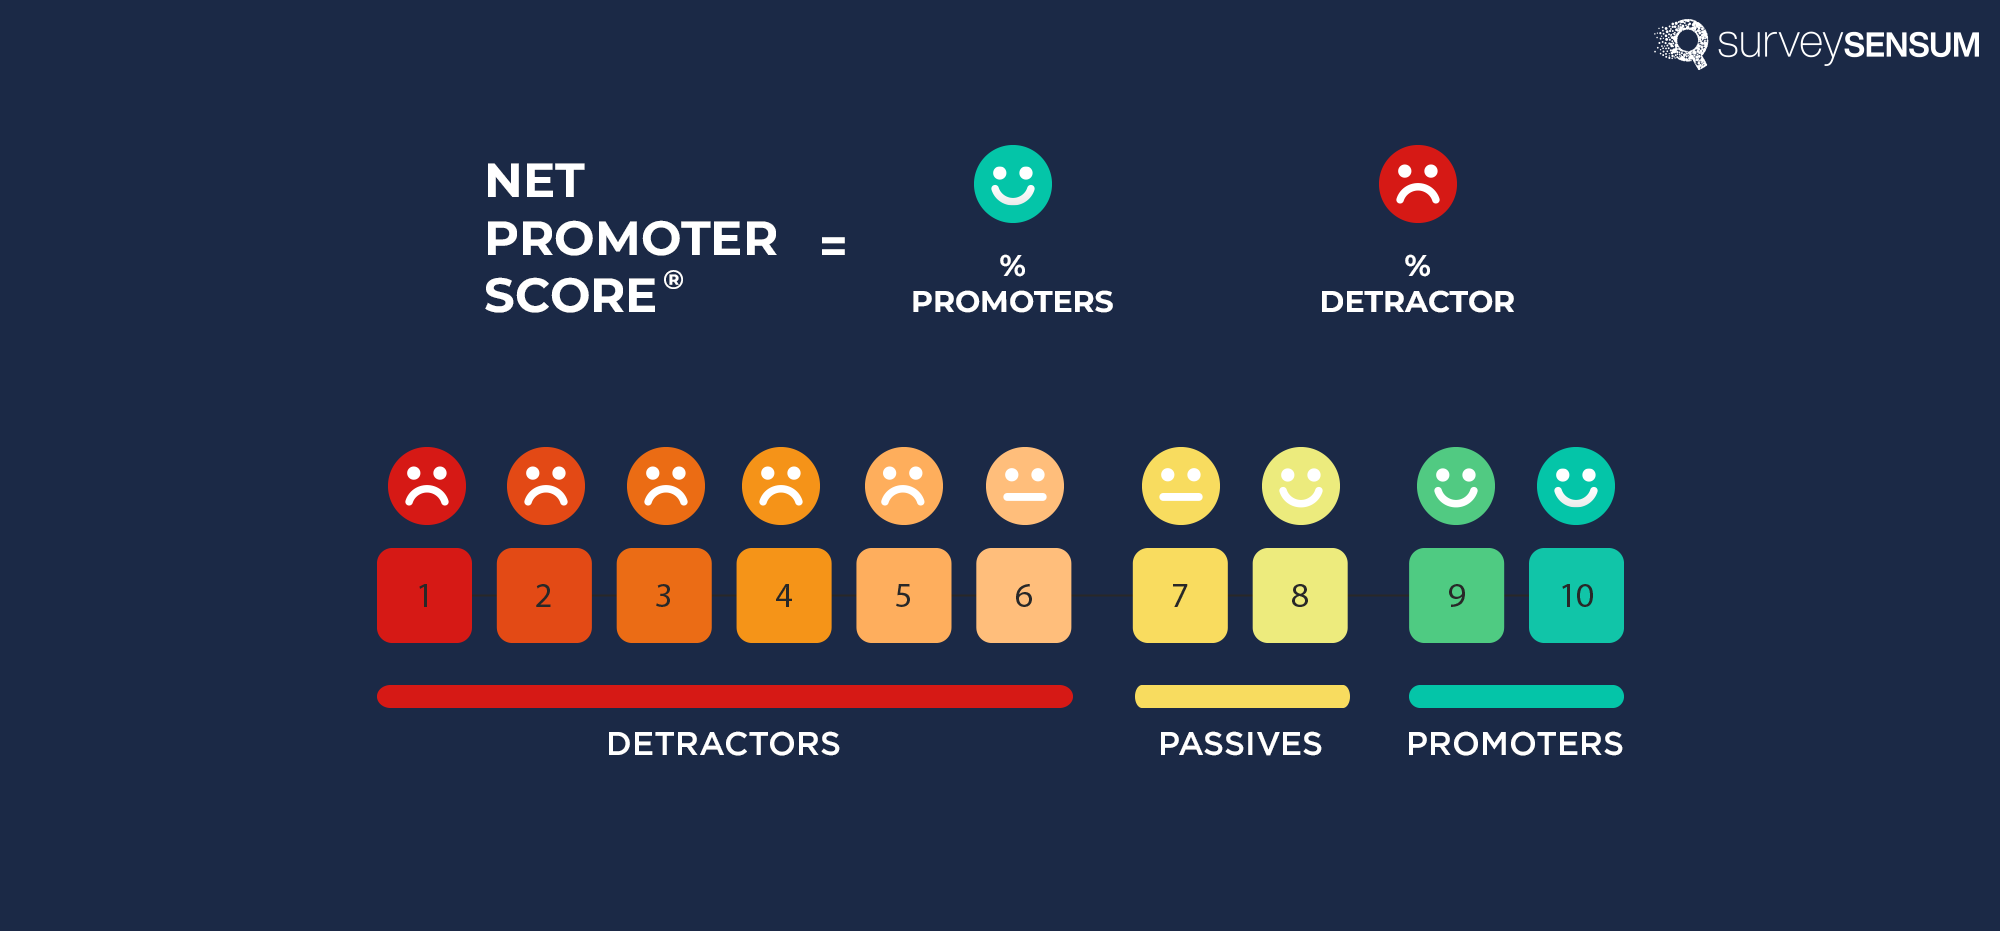
Product NPS is calculated by subtracting the percentage of Detractors from the percentage of Promoters, resulting in a score that can range from -100 to +100.
For example,
Here are the responses you received from 100 customers:
- 60 customers rate your software as 9 or 10 (Promoters).
- 20 customers rate your software as 7 or 8 (Passives).
- 20 customers rate your software as 0 to 6 (Detractors).
To calculate the Product NPS:
Calculate the percentage of Promoters = 60/100 * 100% = 60%
Calculate the percentage of Detractors = 20/100 * 100% = 20%.
Now, subtract the % of Detractors from the % of Promoters = 60%−20%=40%.
So, your Product NPS is 40%.
NPS calculation is done, let’s now discover the reasons why product NPS should matter to product managers.
4 Reasons Your Product NPS Matters
If you are wondering how a simple NPS question can provide you with analytical data and insights into your product development, then let’s understand these 4 reasons why product NPS matters.
1. For Identifying Areas of Improvement and Creating Customer-Centric Products
NPS is a valuable tool for identifying areas of improvement in your product and bridging the gap between what you offer and your customer’s expectations.
So, to do that start analyzing your open-ended feedback with the help of robust text analytics software. Segment your feedback into different categories based on their keyword with AI-based automation. After this, you will be able to identify the areas where your product falls short or excels. The analytical NPS report, generated by the tool, will present you with a detailed overview of specific customer pain points, shed light on what features are lacking, and will also let you what’s working.
With this clear vision in front of you can improve your product to better meet customer needs and preferences, ultimately driving customer-centricity.
2. For Benchmarking Against Competitors and Position Yourself
As product managers, you want your product to be the best in the market, meet customer’s expectations, and of course, beat the competition. But you won’t meet all these goals by just doing NPS surveys and calculating your NPS score. You also need to understand where your position is in the market in order to beat the competition.
This is where NPS benchmarking comes in.
Comparing your NPS with industry benchmarks and competitors’ scores allows you to assess your standing within the market. If you are lagging behind, then do a detailed competitor analysis to identify the areas that you are lagging in. This will help you create a detailed action plan with a clear vision and objectives to surpass your competitors and create the best product in the market.
Step-by-Step Process on NPS Benchmarking – Download Now!
3. Incorporating Data into Product Development
What’s the point of collecting data on product NPS if you are not going to leverage it for product development?
Prioritize product development and feature updates based on feedback from detractors and passives to address pain points and capitalize on strengths. By doing so, you not only ensure that your product remains relevant and competitive in the marketplace, but you also foster a sense of trust in your customers as they feel respected and that their feedback is valued.
4. For Optimising Product Roadmap
With product NPS data, you not only create a customer-centric product but also optimize your product roadmap. The NPS data gives you an insight into what your customers expect from you right now and also gives you a sneak peek into what their future expectations might be. So that you can update your roadmap and prioritize your product or feature development, accordingly. Now, gaining this insight will help you make strategic decisions about resource allocation and investment in product development.
How to Use NPS (Effectively) As Project Managers?
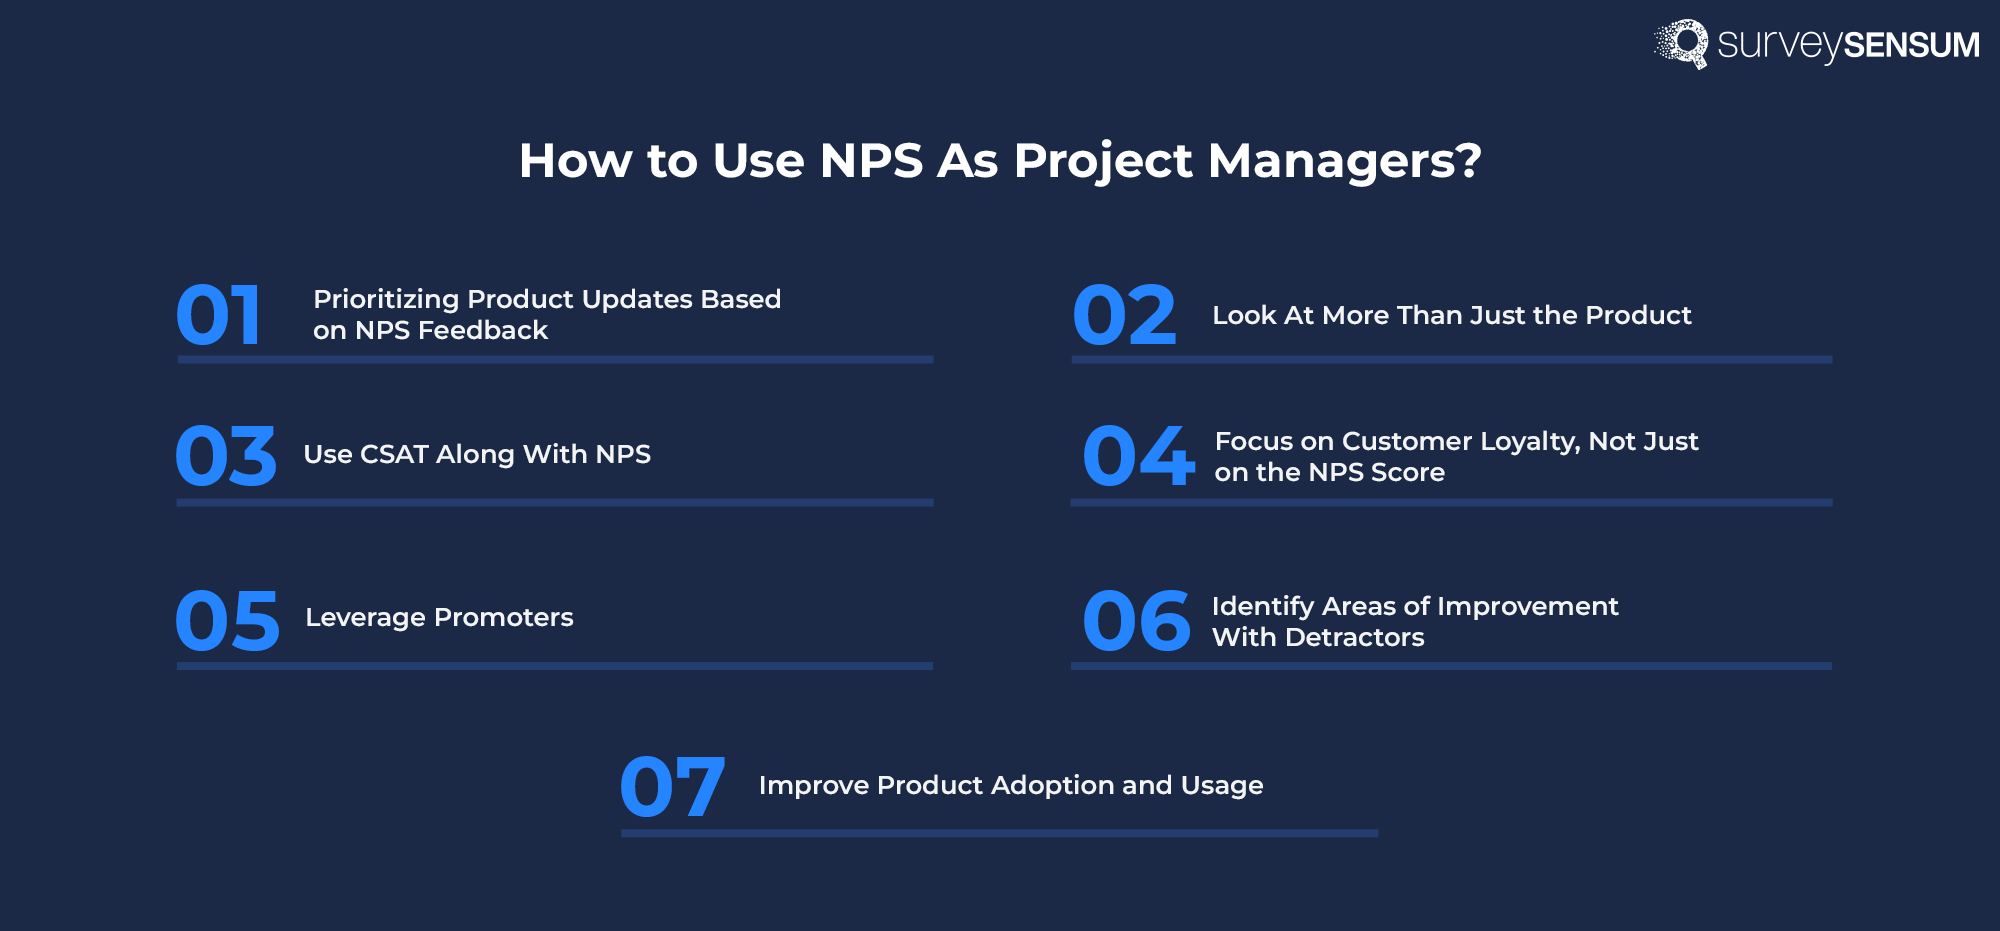
Collecting data is just the beginning of improving your NPS. Once you have the data, you also need to put it to use to keep on building customer-centric products and drive business growth. So, here are a few tried and tested ways of how to use your product NPS data effectively for product development.
1. Prioritizing Product Updates Based on NPS Feedback
When you launch a survey, you receive a lot of suggestions, product update requests, and new feature requests from your customers. While this data is valuable, you can’t actually act on each and every one of them.
Then, how can you prioritize and create a better action plan? With your product NPS data.
Here’s how you can translate your NPS data into actionable initiatives.
- Use text analytics software to automate the process of analyzing NPS feedback to identify and segment recurring themes and trends among promoters, passives, and detractors.
- Work closely with cross-functional teams, including product development, marketing, and customer support, to prioritize updates and enhancements that address the most critical pain points and capitalize on strengths highlighted by promoters.
- Continuously monitor NPS scores over time to assess the impact of product updates and enhancements on customer satisfaction and loyalty. Iterate on your approach based on feedback and adjust priorities accordingly to drive ongoing improvement.
Prioritize your product feature updates to better meet your customer expectations by analyzing your NPS data effectively with SurvyeSensum.
Free Forever • No Feature Limitation • No Credit Card Required • Sign Up For Free ![]()
2. Look At More Than Just the Product
The simple NPS question – “How likely are you to recommend your product to your friends and colleagues?” obviously is a straightforward way to understand where your product stands among your customers and gives a clear picture of product satisfaction.
But that’s not all.
While NPS is traditionally associated with product satisfaction, project managers can broaden their perspective to consider the entire customer experience. This includes interactions with customer support, onboarding processes, billing procedures, and more.
Here’s how you can use NPS data to improve customer experience.
- Collaborate with stakeholders across departments to gather feedback on various touchpoints in the customer journey. Use customer journey mapping to visualize the end-to-end experience and identify areas for improvement.
- Incorporate qualitative feedback from surveys, customer interviews, and support tickets to supplement NPS data and gain deeper insights into customer needs and pain points.
- Take a holistic approach to project management by aligning initiatives with broader business objectives, such as improving customer retention, increasing lifetime value, or driving revenue growth.
- Consider how improvements in non-product areas can impact overall customer satisfaction and loyalty.
3. Use CSAT Along With NPS
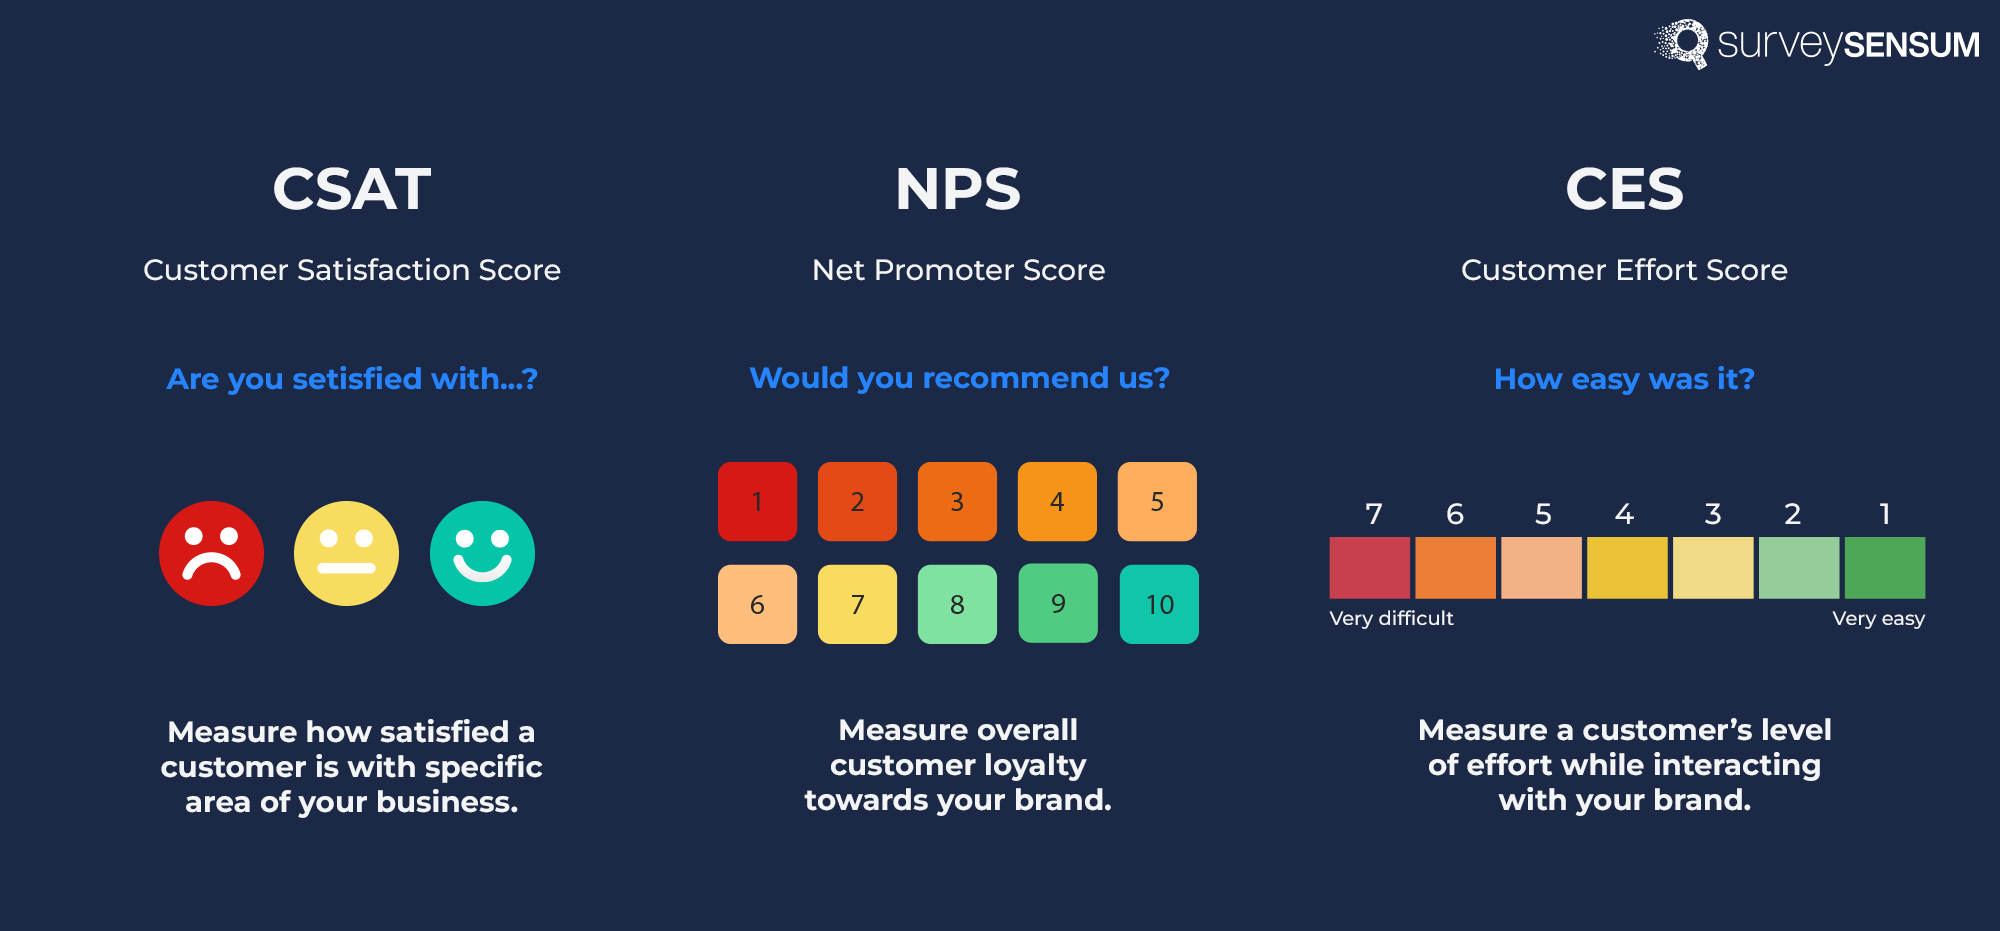
While product NPS provides a broader view of overall customer loyalty and the likelihood of recommending the product, you also need to other CX metrics like CSAT to understand the overall customer satisfaction level of your customers. This will enable you to get a holistic view on all aspects of your product.
Combining CSAT and NPS data allows you to validate customer feedback and gain a more nuanced understanding of their satisfaction levels.
For example, if NPS is high but CSAT for a particular feature is low, it indicates that there may be underlying issues in your product that need to be addressed.
4. Focus on Customer Loyalty, Not Just on the NPS Score
More often than not, businesses pay too much attention to their NPS score. However, the goal is not to get a good score but to improve customer satisfaction and loyalty.
While NPS is a valuable indicator of customer loyalty and advocacy, it is also important to recognize that loyalty is influenced by a variety of factors beyond just the NPS score. Factors such as ease of use, delivery experience, etc are also important and need to be tracked and measured.
So, as project managers, emphasize the importance of driving customer loyalty through actions that reduce customer effort, improve satisfaction, and exceed customer expectations at every touchpoint. Encourage teams to focus on delivering exceptional experiences that build trust, foster long-term relationships, and ultimately drive customer loyalty. This involves streamlining processes, enhancing product features, or providing personalized support.
5. Leverage Promoters
Your promoters are happy customers, so happy that they might become your brand advocate and spread the good word, so why not leverage that potential? Turning your promoters into brand advocates is a brilliant way to get organic word-of-mouth referrals.
So,
- Reach out to your promoters to understand what they love about your product and what further improvements they suggest.
- Engage them in follow-up interviews to delve deeper into their positive experiences.
- Consider inviting promoters to participate as beta testers for new features or to provide feedback through methods like completing friction logs. Their insights can be invaluable for refining and enhancing your product.
→ Here’s how to create brand advocates.
6. Identify Areas of Improvement With Detractors
Just like your Promoters, your Detractors are also a winning ticket to boosting customer satisfaction and loyalty. This section of your customers are genuinely unhappy with your product, but don’t let that discourage you. In fact, leverage them to identify areas of improvement and ultimately convert your Detractors into Promoters.
Here’s how to do that.
- Gather in-depth feedback from detractors to understand their pain points and challenges. Get on a call with them and understand their pain points in a one-on-one meeting.
- Track detractors’ interactions with specific product features to pinpoint areas of friction and inefficiency. Heatmap analysis can reveal differences in behavior between detractors and promoters, highlighting areas where improvements are needed.
- Utilize in-app feedback surveys to gather real-time insights from detractors as they navigate the product. Prompting them for feedback at relevant touchpoints can provide valuable context for improving the user experience.
7. Improve Product Adoption and Usage
What is the direct indication of improved satisfaction in SaaS? When your product adoption and usage improves among your users.
So, here’s how you can leverage product NPS data to improve your product adoption and usage.
- Identify barriers to adoption and streamline the onboarding process to make it easier for users to get started with your product.
- Provide resources and support to help users fully utilize the features and capabilities of your product.
- Continuously monitor CX metrics, including NPS, to track the impact of product improvements on overall satisfaction levels.
- Use feedback from promoters and detractors to inform iterative enhancements and optimizations to drive ongoing satisfaction and loyalty.
10 Product NPS Survey Questions
Here are some effective product NPS questions you can ask in your next product NPS survey.
- On a scale of 0-10, how likely are you to recommend [Product Name] to a friend or colleague?
- What specifically do you like most about [Product Name]?
- What improvements would you suggest for [Product Name]?
- How frequently do you use [Product Name]?
- How satisfied are you with the overall performance of [Product Name]?
- How does [Product Name] compare to similar products you’ve used in the past?
- Have you encountered any difficulties or challenges while using [Product Name]?
- How likely are you to continue using [Product Name] in the future?
- How responsive has our support team been to any issues you’ve faced with [Product Name]?
- How would you rate the value for money of [Product Name] compared to its price?
So, launch your product NPS survey today with SurveySensum and measure, analyze, and improve your customer satisfaction and loyalty!
Free Forever • No Feature Limitation • No Credit Card Required • Get a Live Demo ![]()
Other CX Metrics for Tracking Customer Sentiment
Tracking customer sentiment and satisfaction involves more than just NPS. Here are some other customer experience metrics you should consider incorporating into your strategy, along with NPS.
1. Product-Market Fit Score
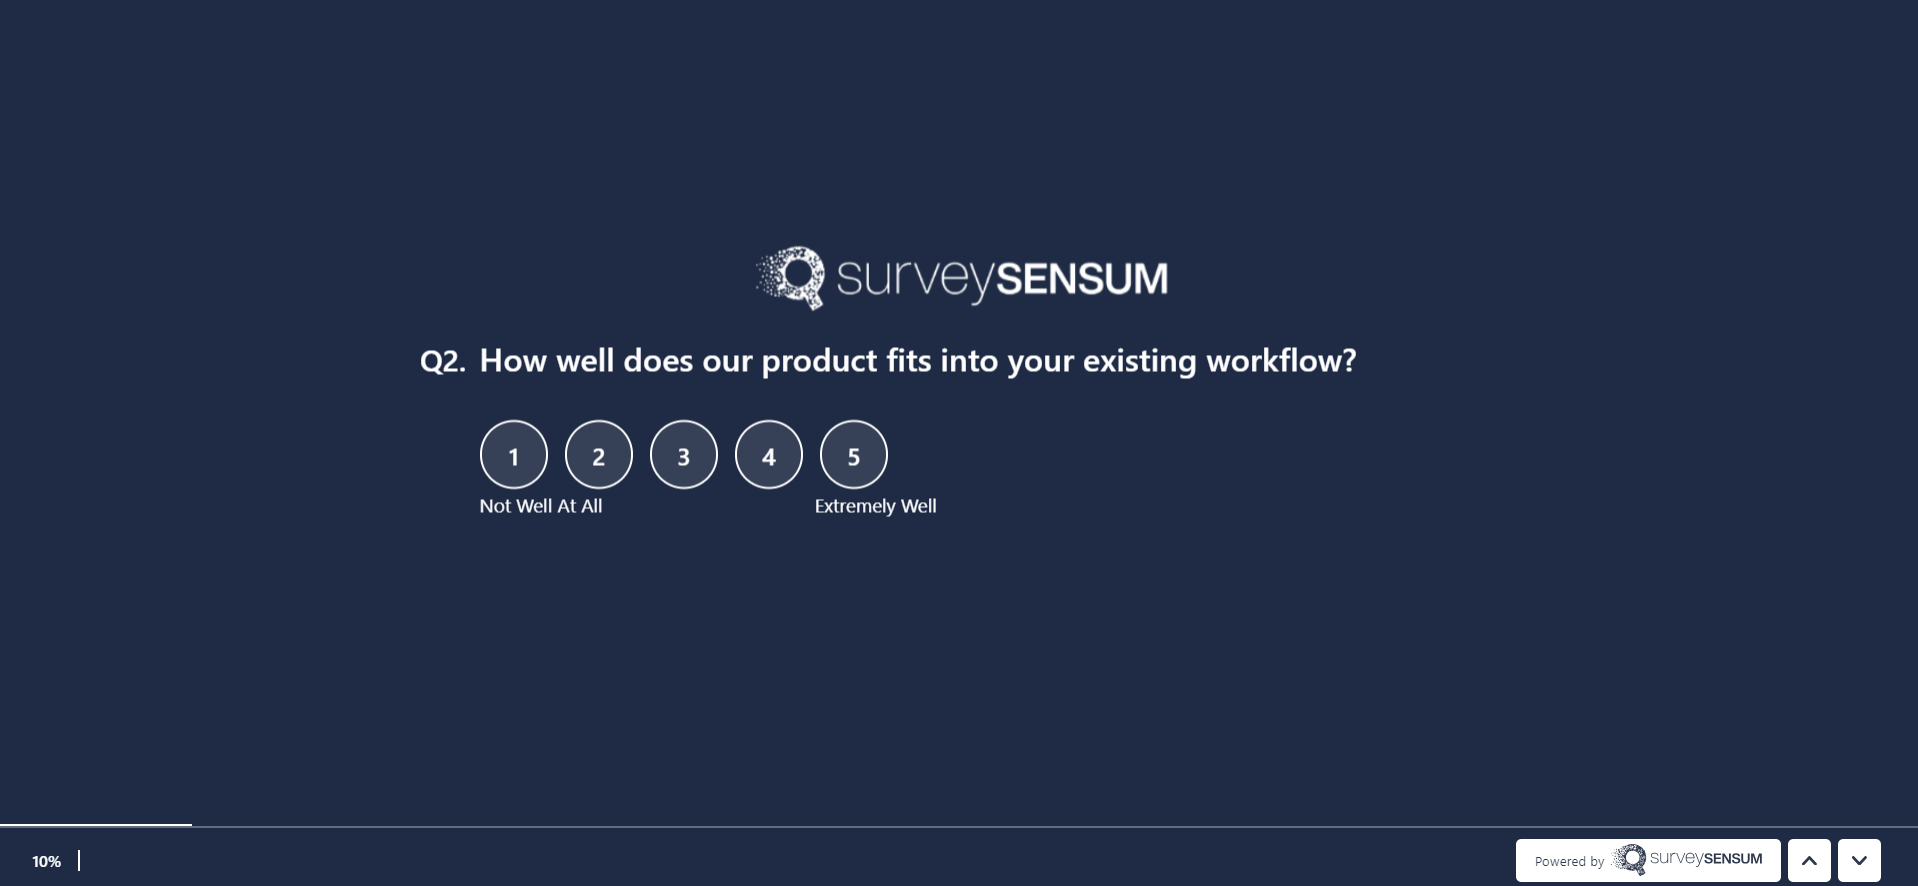
→ On a scale of 1 to 10, how well does our product/service meet your needs?
The product-market fit score measures how well your product or service fits the needs and expectations of your target market. If this score is low despite a high NPS, it may indicate that while customers like the product, it might not fully align with their needs.
2. Customer Effort Score
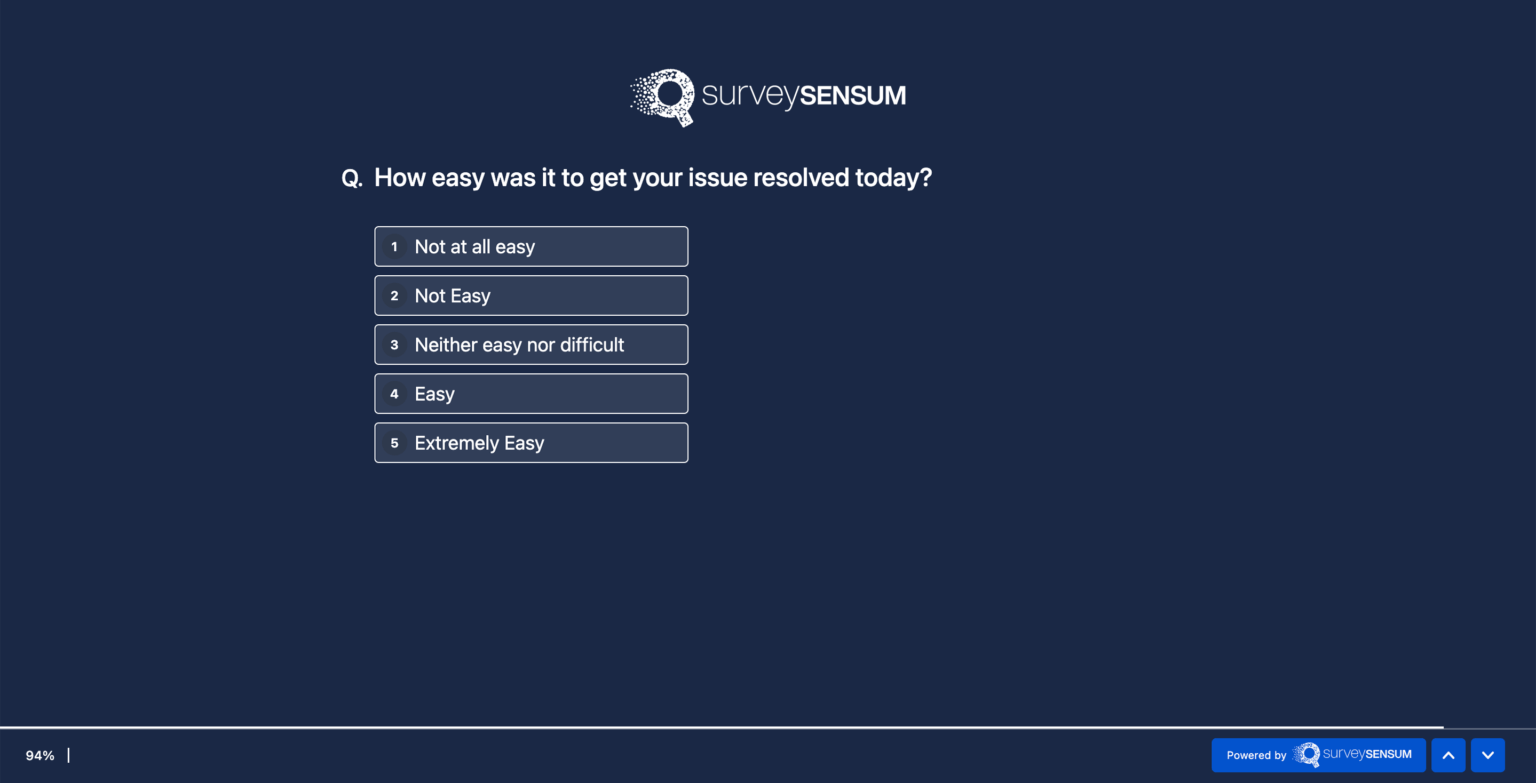
→ How easy was it to get started with our product?
CES assesses the ease of the customer experience by measuring how much effort customers have to exert to accomplish their goals when interacting with your product or service. A low CES alongside a high NPS could indicate that while customers are satisfied overall, they may find certain aspects of the experience frustrating or time-consuming, potentially impacting their loyalty in the long run.
3. New Referral Customers
It tracks the number of new customers acquired through referrals from existing customers. Tracking new referral customers alongside NPS helps validate whether promoters are actively advocating for your brand and bringing in new business.
→ Want to ask a client for a referral? Discover the correct and efficient way to ask for a referral from a client.
4. CSAT
→ How satisfied are you with the new product feature?
CSAT measures the satisfaction level of customers with specific interactions or experiences, such as a recent purchase, support interaction, or service encounter. While NPS provides an overall sentiment, CSAT helps pinpoint areas of strength or weakness within the customer journey.
For example, a high NPS alongside a low CSAT for customer support interactions indicates a gap between overall satisfaction and support quality.
5. Customer Health Score
Customer health score gives a holistic view of the overall health and satisfaction of your customer base by combining various data points such as usage patterns, customer engagement metrics, support interactions, and feedback scores.
While NPS provides a snapshot of overall loyalty and advocacy, the Customer Health Score incorporates various data points to assess the overall well-being of customer relationships, including usage patterns, engagement metrics, and support interactions. A high NPS coupled with a declining Customer Health Score may signal potential churn risks despite positive sentiment.
These CX metrics offer valuable insights into different aspects of the customer experience and sentiment, allowing you to better understand customer needs, identify areas for improvement, and foster long-term relationships with your customers.
Conclusion
Leveraging product NPS data as part of a product development strategy empowers product managers to make data-driven decisions, prioritize customer-centric initiatives, and drive continuous improvement in product quality and customer experience. And while NPS is a valuable metric for gauging overall customer loyalty and advocacy, it’s essential to supplement it with other CX metrics, such as CSAT, CES, etc, to gain a comprehensive understanding of customer sentiment.
Now, in order to collect relevant product NPS data and utilize it in your product development strategy, you need a robust NPS software like SurveySensum to analyze your NPS program. The tool comes with all the basic and advanced survey features you need to launch a successful NPS program, but that’s not all – it also provides a team of CX experts who provide end-to-end CX consultation to derive actionable insights and drive business growth.
Utilize Product NPS & Create Customer-Centric Products With SurveySensum
Free Forever • No Feature Limitation • No Credit Card Required • Sign Up For Free ![]()
Frequently Asked Questions
1. What is NPS for product?
NPS for a product is a metric used to measure customer loyalty and satisfaction with a specific product or service. It assesses the likelihood of customers recommending the product to friends and colleagues. Customers are then categorized into Promoters (score 9-10), Passives (score 7-8), and Detractors (score 0-6), and the NPS is calculated by subtracting the percentage of Detractors from the percentage of Promoters.
2. What is a good NPS for a new product?
Generally, an NPS above 0 is considered positive, indicating that there are more Promoters than Detractors. However, what constitutes a “good” NPS may differ from one organization to another. It’s essential to benchmark against previous performance, competitor NPS scores, and industry standards to determine whether the NPS for a new product is satisfactory.
3. How do you measure NPS for a product?
To measure NPS for a product, follow these steps:
- Ask customers the standard NPS question: “On a scale of 0 to 10, how likely are you to recommend this product to a friend or colleague?”
- Categorize respondents into Promoters (score 9-10), Passives (score 7-8), and Detractors (score 0-6).
- Calculate the percentage of Promoters, Passives, and Detractors among respondents.
- Subtract the percentage of Detractors from the percentage of Promoters to obtain the Net Promoter Score.
New to NPS?
List of Features
Looking for NPS Alternative?
Here's the Comparison

Increase ROI by 3x with targeted feedback & analysis
Boost Customer Satisfaction by up to 20%
Reduce Churn by identifying pain points in real time
See it in Action
Contents
4.
CSAT
How much did you enjoy this article?